
Q2 2025 Crude Oil Outlook
Crude Oil Quarterly Outlook: Oil prices continue to respect the broader downtrend that began in 2022, currently anchored at the strong $64–$66 support zone that has held since 2021. Despite a complex mix of OPEC quotas, U.S. policy shifts, Chinese economic dynamics, global growth uncertainty, renewable energy demand, and escalating geopolitical tensions, oil remains range-bound—awaiting a decisive breakout.
Outline
- Key events expected to influence crude oil price action in Q2 2025
- Technical analysis across weekly, monthly, and quarterly charts
Price Overview & Market Context
Oil prices continue to respect the broader downtrend that began in 2022, currently anchored at the strong $64–$66 support zone that has held since 2021. Despite a complex mix of OPEC quotas, U.S. policy shifts, Chinese economic dynamics, global growth uncertainty, renewable energy demand, and escalating geopolitical tensions, oil remains range-bound—awaiting a decisive breakout.
The range-bound nature of oil is fundamentally driven by:
- Trump-era Policies
- Chinese Stimulus Measures and Economic Performance
- OPEC+ Strategy and Member Revenues
- Geopolitical Tensions and Sanction Risks
Brief rallies above the established support zone have been primarily driven by seasonal demand, sanction-related supply concerns, and stimulus hopes. However, for a sustained recovery to take hold, the market will likely need significant catalysts—such as new trade agreements, effective stimulus programs, and improved global growth forecasts—to reconcile rising supply with currently constrained demand.
Trump Policies and Impacts on Oil Prices
Oil forecasts for 2025 remain bearish, largely due to Trump’s pro-drilling stance and the associated oversupply risks under his “drill baby drill” agenda. With this threat looming, OPEC+ countries face declining revenues and potential loss of market share.
Adding to the bearish outlook are the consequences of escalating trade tensions. Trump’s imposition of 25% tariffs on steel and aluminum imports from Canada, Mexico, and the Eurozone, along with 20% tariffs on Chinese exports, triggered retaliatory measures from major global economies. These moves further intensified tariff threats, undermining global economic confidence, weakening growth prospects, and dampening oil demand.
To mitigate the fallout from trade disputes, central banks are recalibrating monetary policy—balancing between rate holds, cuts, and flexible frameworks. The Bank of Canada recently abandoned its forward-guidance approach in favor of scenario-based strategies aimed at managing rising risks. Until the trade outlook clears and economic tensions subside, oil demand forecasts are expected to remain between neutral and bearish.
Chinese Stimulus Measures and Economic Performance
At the start of Q1 2025, Chinese stimulus measures—combined with an export surge ahead of impending U.S. tariffs—temporarily boosted Chinese growth metrics. This, along with seasonal winter demand, pushed oil prices up toward $80 per barrel. However, the rally proved short-lived, and prices soon reverted to their broader bearish trajectory, in place since 2022.
February inflation data from China added to global unease amid ongoing trade tensions. The Consumer Price Index (CPI) fell to -0.7%, while the Producer Price Index (PPI) remained in deflationary territory at -2.2%. In response, China continues to deploy stimulus across housing, domestic consumption, and monetary policy to counter deflation risks—key threats to oil demand. A sustained recovery in Chinese economic indicators will be critical to restoring market confidence and supporting oil prices.
OPEC+ Strategy and Member Revenues
OPEC+ countries face significant challenges amid Trump’s “drill baby drill” agenda and his latest tariff policies, both of which are contributing to declining oil demand and threatening the group’s production strategy and revenue potential. Initially, OPEC signaled a gradual production increase toward 2.2 million barrels per day starting April 2025, however, in response to oversupply concerns, the group reversed course and introduced a new schedule requiring seven member nations to implement additional output cuts—ranging from 189,000 to 435,000 barrels per day—set to remain in effect until June 2026, in an effort to stabilize the market and rebalance supply.
While falling oil prices continue to pressure OPEC members, key producers like the UAE are actively diversifying their economies to reduce dependency on oil revenues. This resilience is reflected in the UAE MSCI Index, which remains near its 2022 highs above the 17-mark, despite the broader decline in oil prices since that time.
Geopolitical Tensions and Sanction Risks
Geopolitical tensions continue to make headlines this quarter, with key flashpoints involving the U.S., Iran, Yemen, Russia, Ukraine, Israel, and Palestine—all significantly impacting oil prices.
- U.S.–Yemen: Tensions center around securing the Red Sea and protecting Israel from Iran-backed Houthi forces in Yemen. Given the Red Sea’s strategic role in global oil transportation, any escalation poses serious supply concerns and increases upside hedging risks.
- U.S.–Iran: Strained relations over Iran’s nuclear program have led the U.S. to impose sanctions targeting all Iranian oil exports. Further escalation could drive oil prices higher due to reduced global supply.
- Israel–Gaza Conflict: The recent collapse of a ceasefire deal has reignited fears of broader regional escalation, renewing upward pressure on oil prices through increased geopolitical risk premiums.
- Russia–Ukraine War: While diplomatic efforts continue, the prolonged conflict—especially attacks on critical energy infrastructure—remains a key factor in maintaining upside hedging demand in the oil market.
Although current price pressures are driven by geopolitical risk, the emergence of peace agreements or de-escalation in any of these regions could reverse sentiment and apply bearish pressure by reducing the need for risk hedging in oil.
Technical Analysis: Navigating Key Levels
Oil prices remain largely range-bound, as the interplay between sanctions, peace agreements, government stimulus measures, and oversupply risks keeps the market fluctuating near a critical four-year support zone between $64 and $66. This zone represents the 50% Fibonacci retracement level of the uptrend from 2020 to 2022, during which oil prices rebounded from below $0 to above $120 per barrel.
Crude Oil Forecast: 3-Month Time Frame – Log Scale
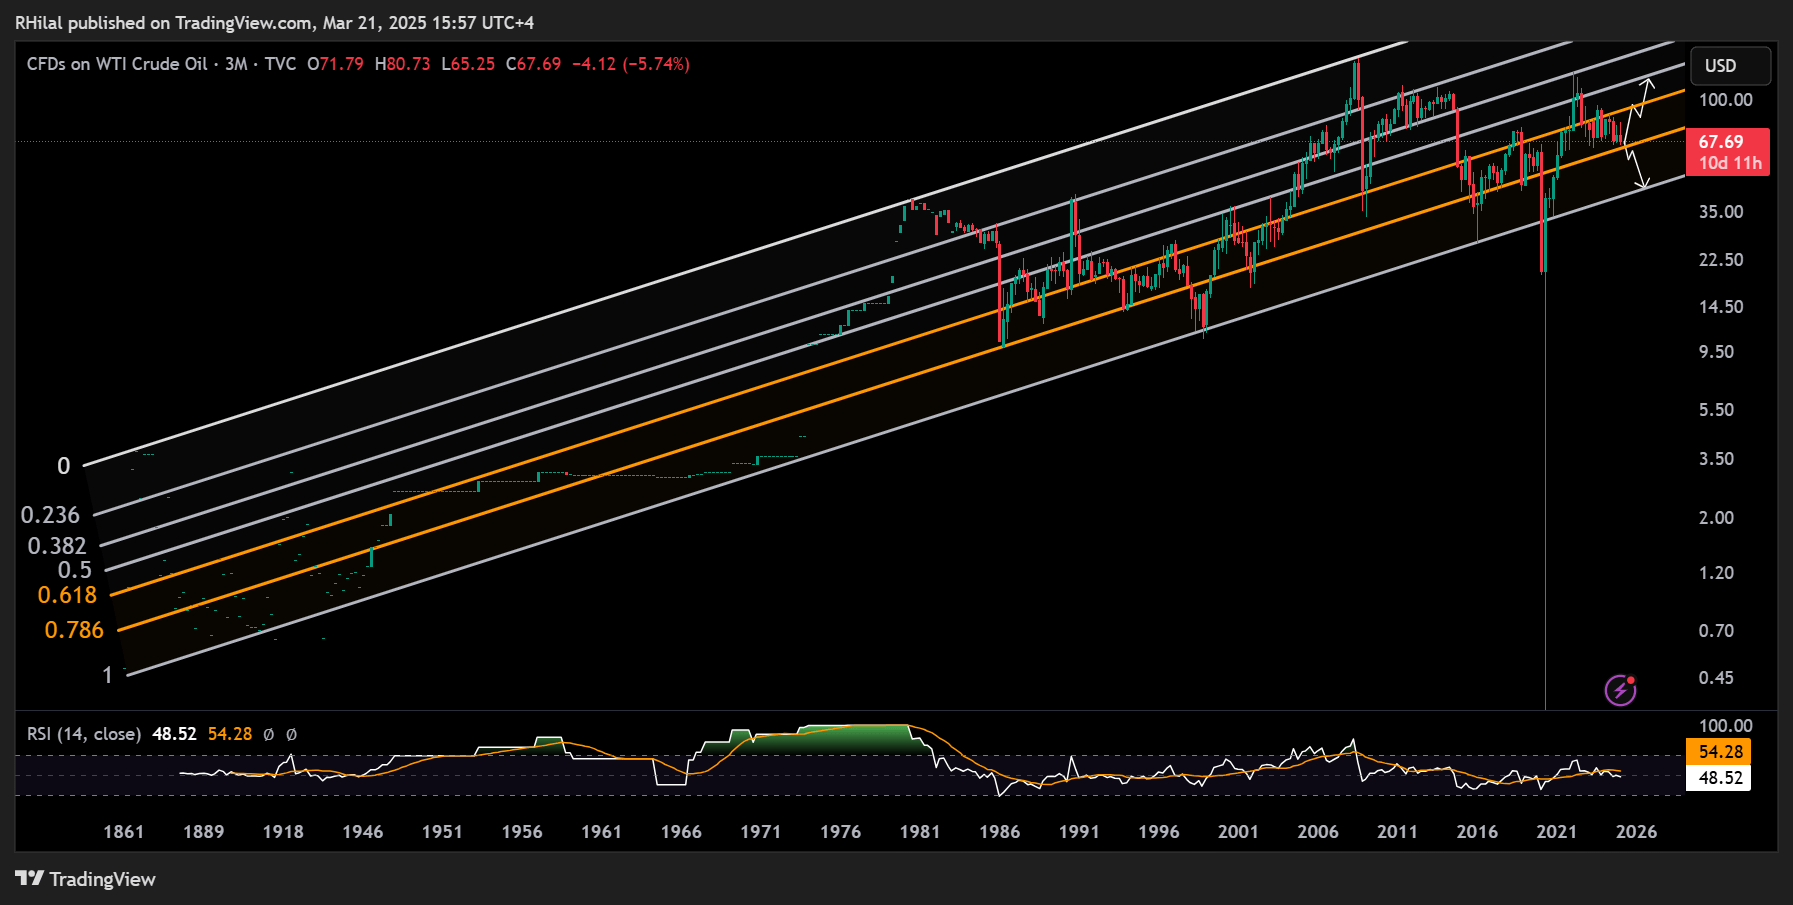
Source: Tradingview
From a 3-month perspective, crude oil continues to follow a long-term uptrend that dates back to the 1800s, consistently respecting parallel channel boundaries and Fibonacci levels.
Currently, prices are holding near the 0.786 Fibonacci ratio—an important trend support level. This zone represents a key inflection point between a potential bullish rebound or a deeper drawdown toward the $49 level, which aligns with the lower boundary of the historical uptrend. Notably, this lower boundary was only breached once—during the extreme volatility of 2020—after confirmed breakdowns below the $60 and $55 levels.
On the upside, if prices maintain their position above the 0.786 level and the critical $66 support zone, the uptrend may regain momentum. In that scenario, crude could target the 0.618 Fibonacci level, which aligns with the $89 price zone.
Crude Oil Forecast: Monthly Time Frame – Log Scale
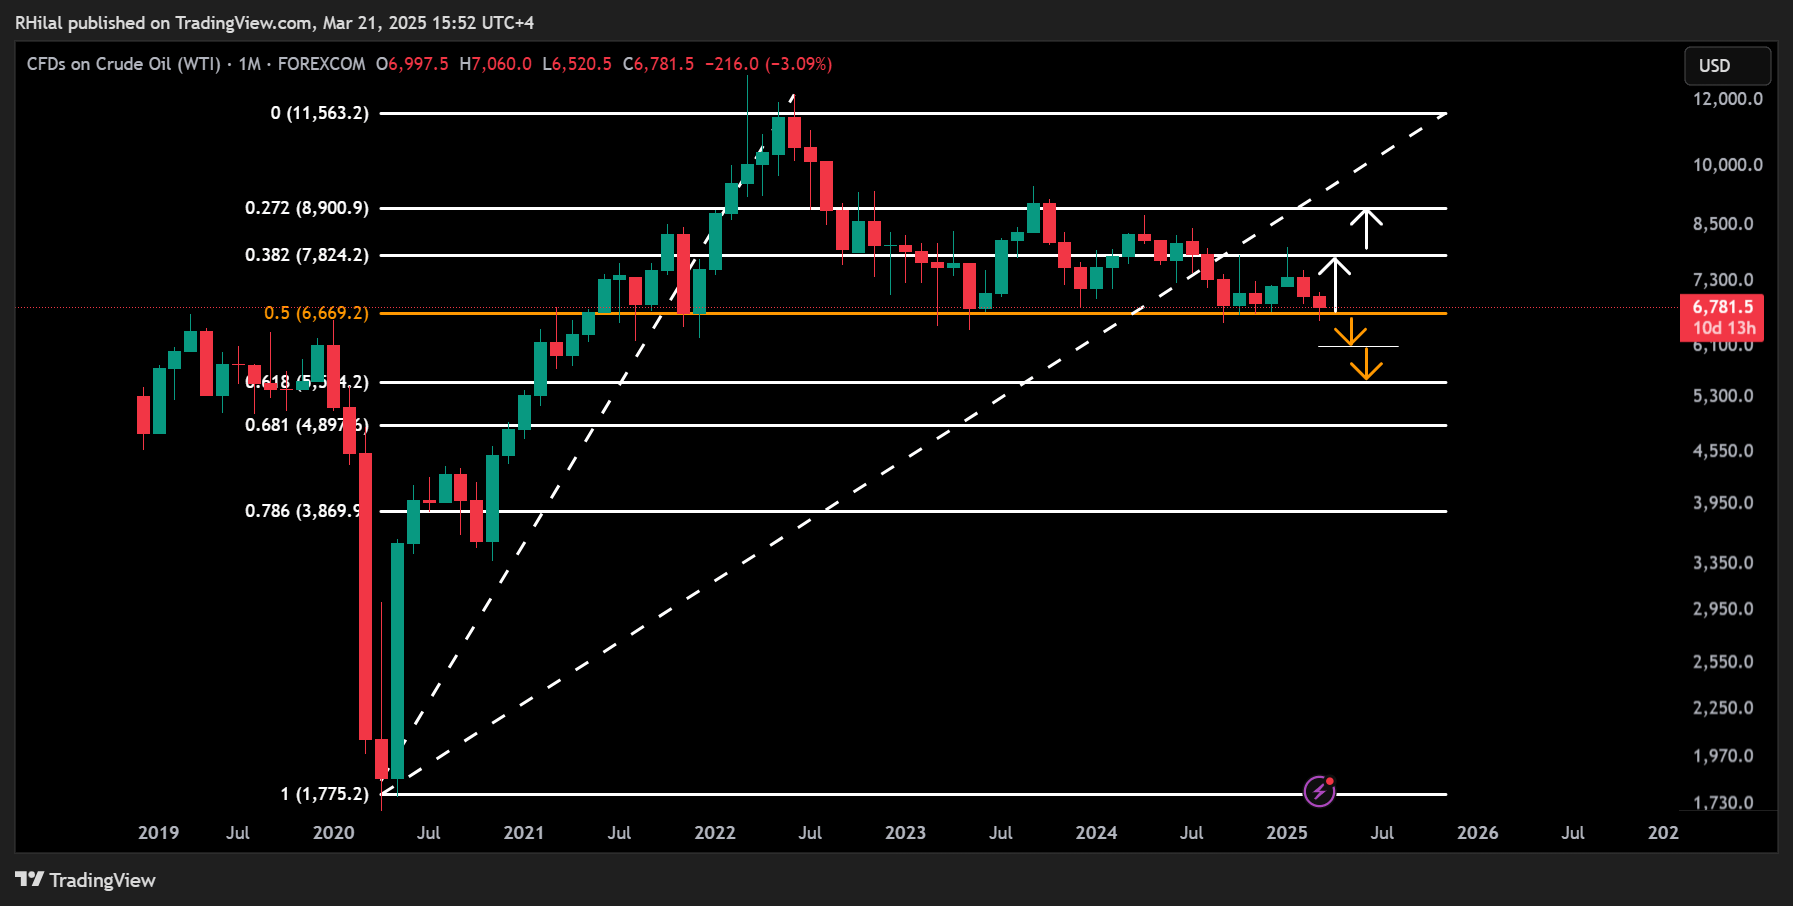
Source: Tradingview
From a monthly time frame perspective, crude oil prices are currently holding at the 50% Fibonacci retracement level of the 2020–2022 uptrend, aligning with the key $66 support zone. A decisive close below this level could open the path toward the 0.618 Fibonacci retracement near $55, with intermediate support potentially emerging at the $60 psychological level.
On the upside, if the $66 zone continues to hold, oil may retrace higher toward the $78 level, corresponding with the 0.382 Fibonacci retracement. A sustained breakout beyond this point could extend gains toward the $89 zone, reinforcing a more bullish outlook.
Crude Oil Forecast: Weekly Time Frame – Log Scale
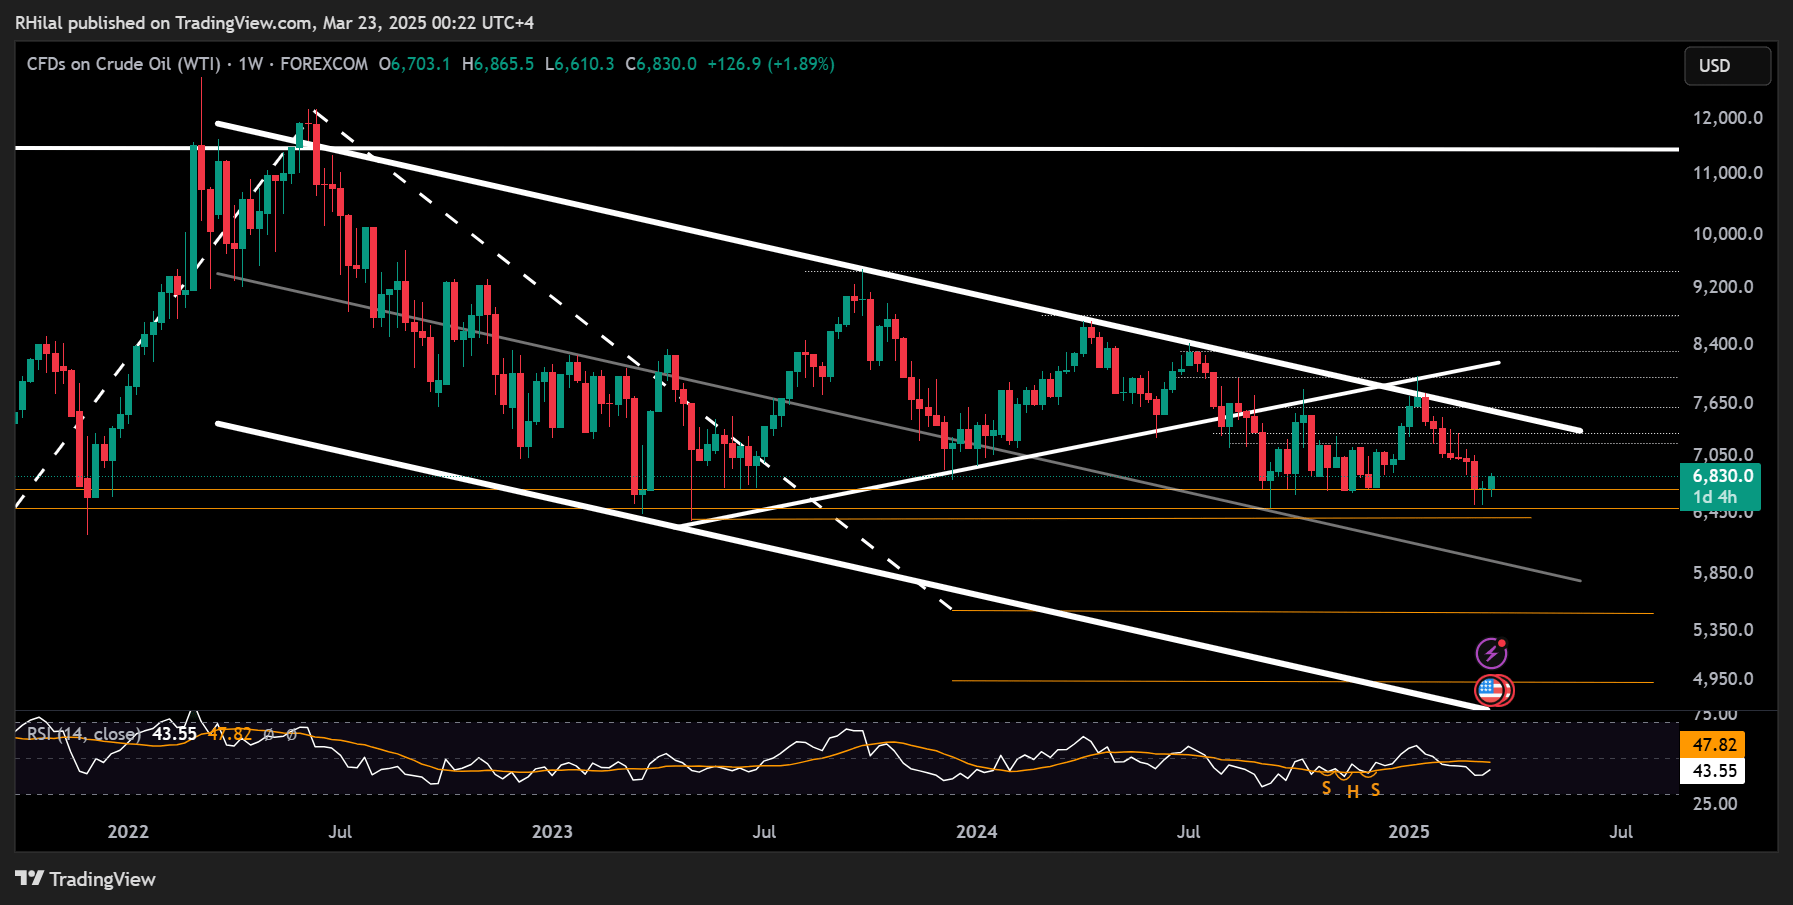
Source: Tradingview
From a weekly time frame perspective, oil prices have continued to respect the boundaries of a declining channel since the 2022 highs, reaching three-year lows in 2025, in alignment with the long-standing support zone between $64 and $66 that has held since 2021. After recently rebounding from the $65 level, a decisive close below $63.80 would confirm further downside potential, opening the way toward key support levels at $60, $55, and, in more extreme scenarios, $49.
If the support zone holds, resistance levels within the declining channel may come into play at $72, $73, and $76. A breakout above the channel’s upper boundary and a sustained hold above $78 could shift the outlook to bullish, with potential resistance at $80, $84, $89, and the $93–$95 range.
Written by Razan Hilal, CMT, Market Analyst
Follow Razan on X: @RH_Waves