
Q2 2025 USD/JPY Outlook
- U.S. economic momentum fades as data underwhelms, dragging yields lower
- Hawkish BOJ sees yield differentials compress, driving sharp pullback in USD/JPY
- USD/JPY sensitive to shifts in Japan’s interest rate outlook
- Trade war risks loom, with potential tariff impacts highly uncertain
- Key downside levels in focus, with 146.50 the first test for bears
Summary
USD/JPY movements have been driven by contrasting economic performances in early 2025. U.S. data has softened while Japan’s has strengthened, narrowing yield differentials which has pushed the USD/JPY lower. Trade tensions add more uncertainty, especially with potential U.S. tariffs on Japanese imports looming in early April. Given the tricky macroeconomic environment, the prevailing bearish bias remains entering the June quarter.
U.S. Economic Exceptionalism Questioned
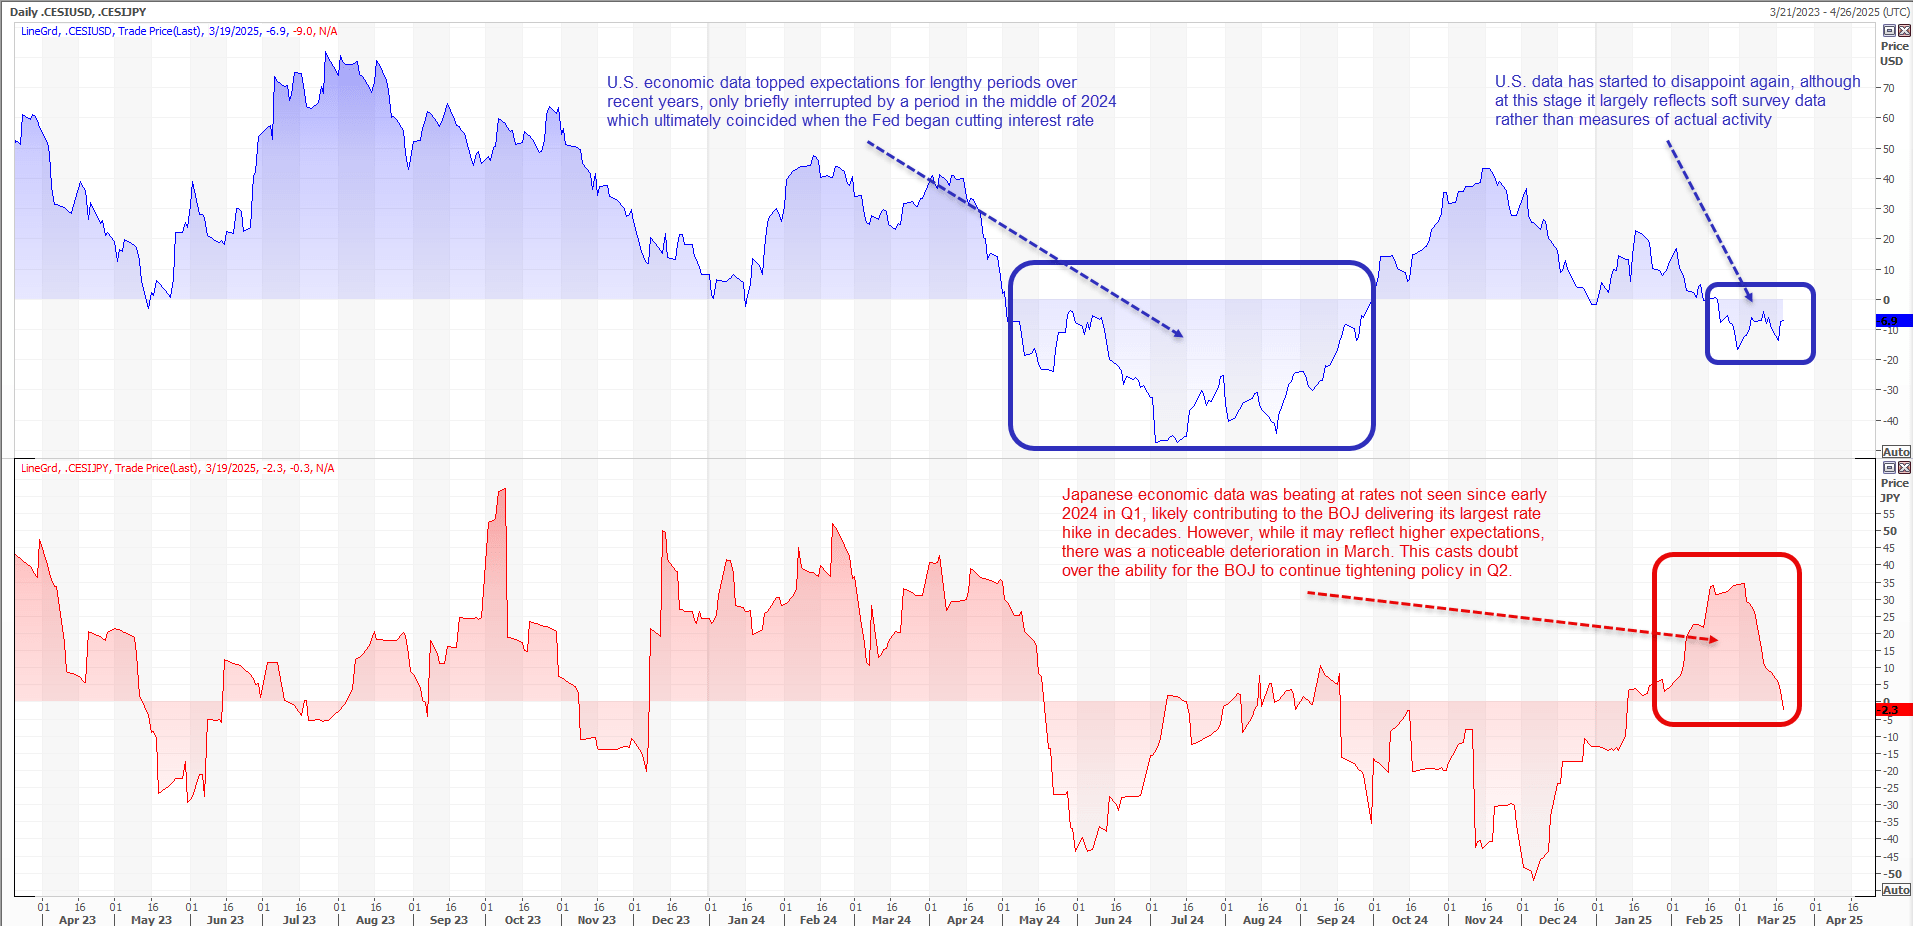
U.S. economic exceptionalism was a hallmark of the post-pandemic recovery, with activity not only remaining strong for long periods but also defying expectations for a slowdown. Citi’s Economic Surprise Index (CESI) underlines this point, sitting in positive territory for lengthy stretches over the past two years.
Source: Refinitiv
The CESI measures how economic data prints relative to market expectations. A positive reading means data is beating forecasts, suggesting stronger economic momentum, while a negative reading indicates weaker-than-expected data. It’s a gauge of sentiment shifts rather than absolute economic strength—a useful indicator because markets react more to surprises than actual levels.
While U.S. economic exceptionalism looked entrenched, a rare bout of underperformance earlier this year coincided with a sharp decline in U.S. interest rates across the Treasury curve.
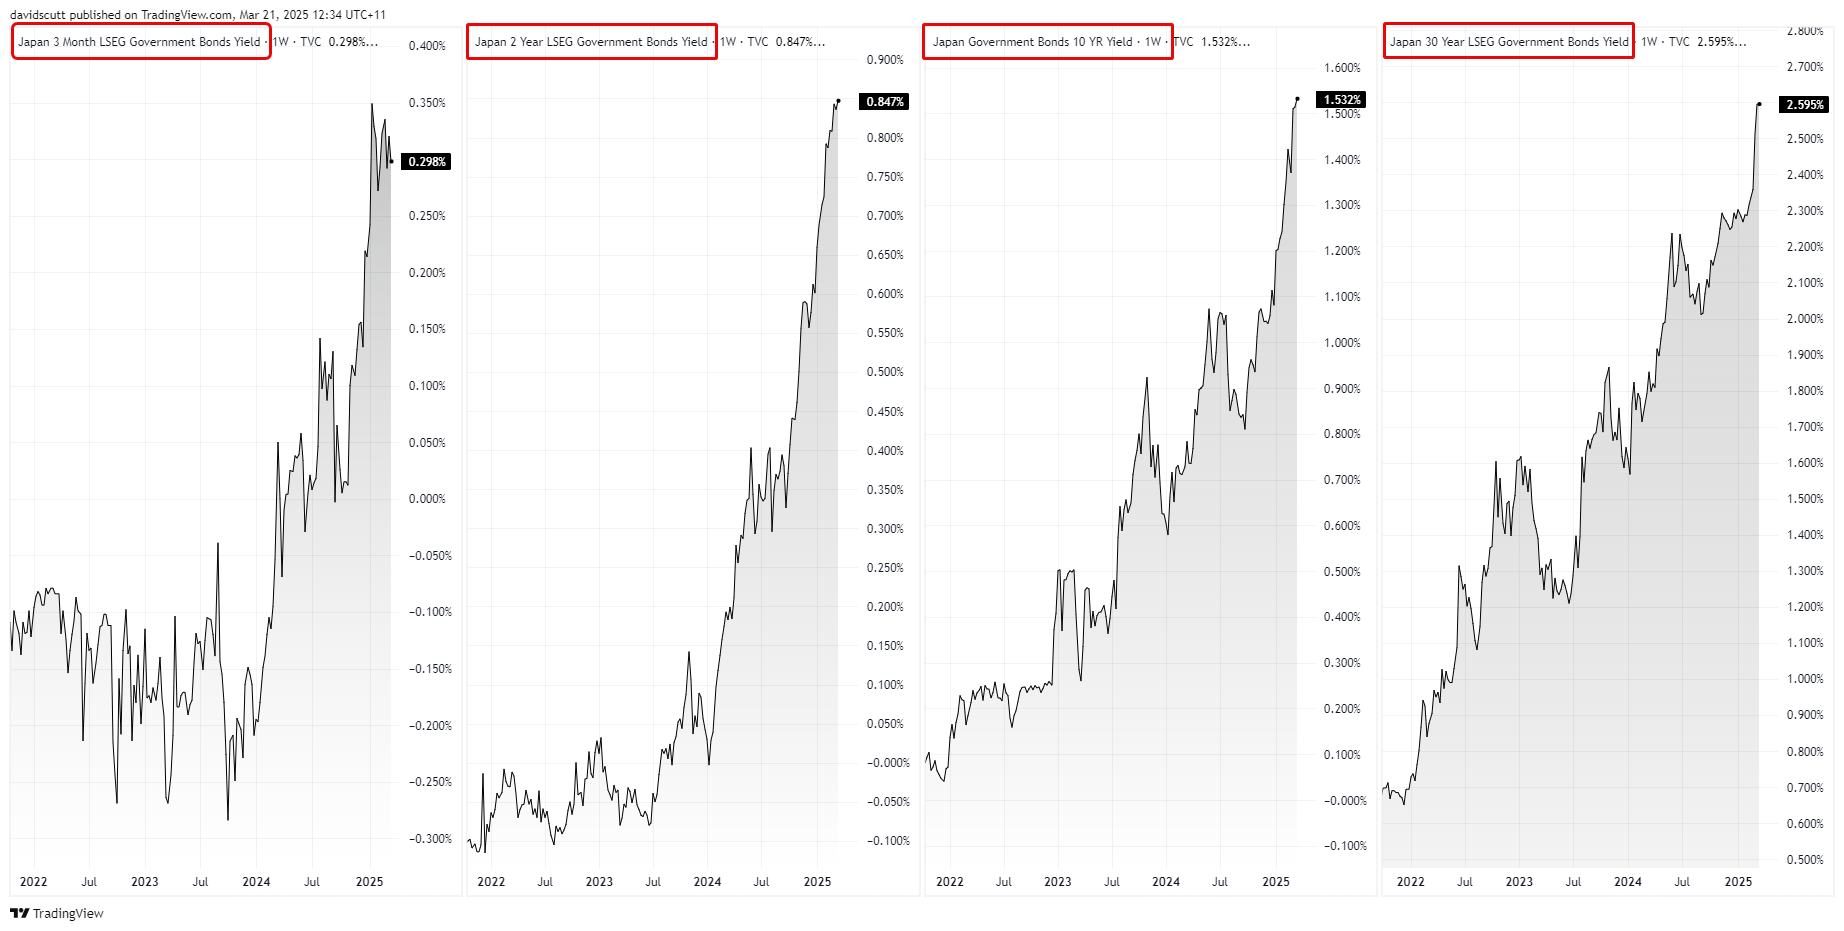
At the same time, Japanese data was beating expectations at levels not seen in nearly a year, allowing the BOJ to deliver its largest rate increase in nearly two decades. That helped drive a significant rise in yields across the Japanese government bond (JGB) curve.
Source: TradingView
Yield Differentials Compress, Dragging USD/JPY Lower
The net effect of the divergent economic performance was a sharp compression in 10-year yield differentials between the U.S. and Japan, leading to a sizeable pullback in USD/JPY in Q1. The left and middle panes of the chart below highlight the clear relationship between the two.
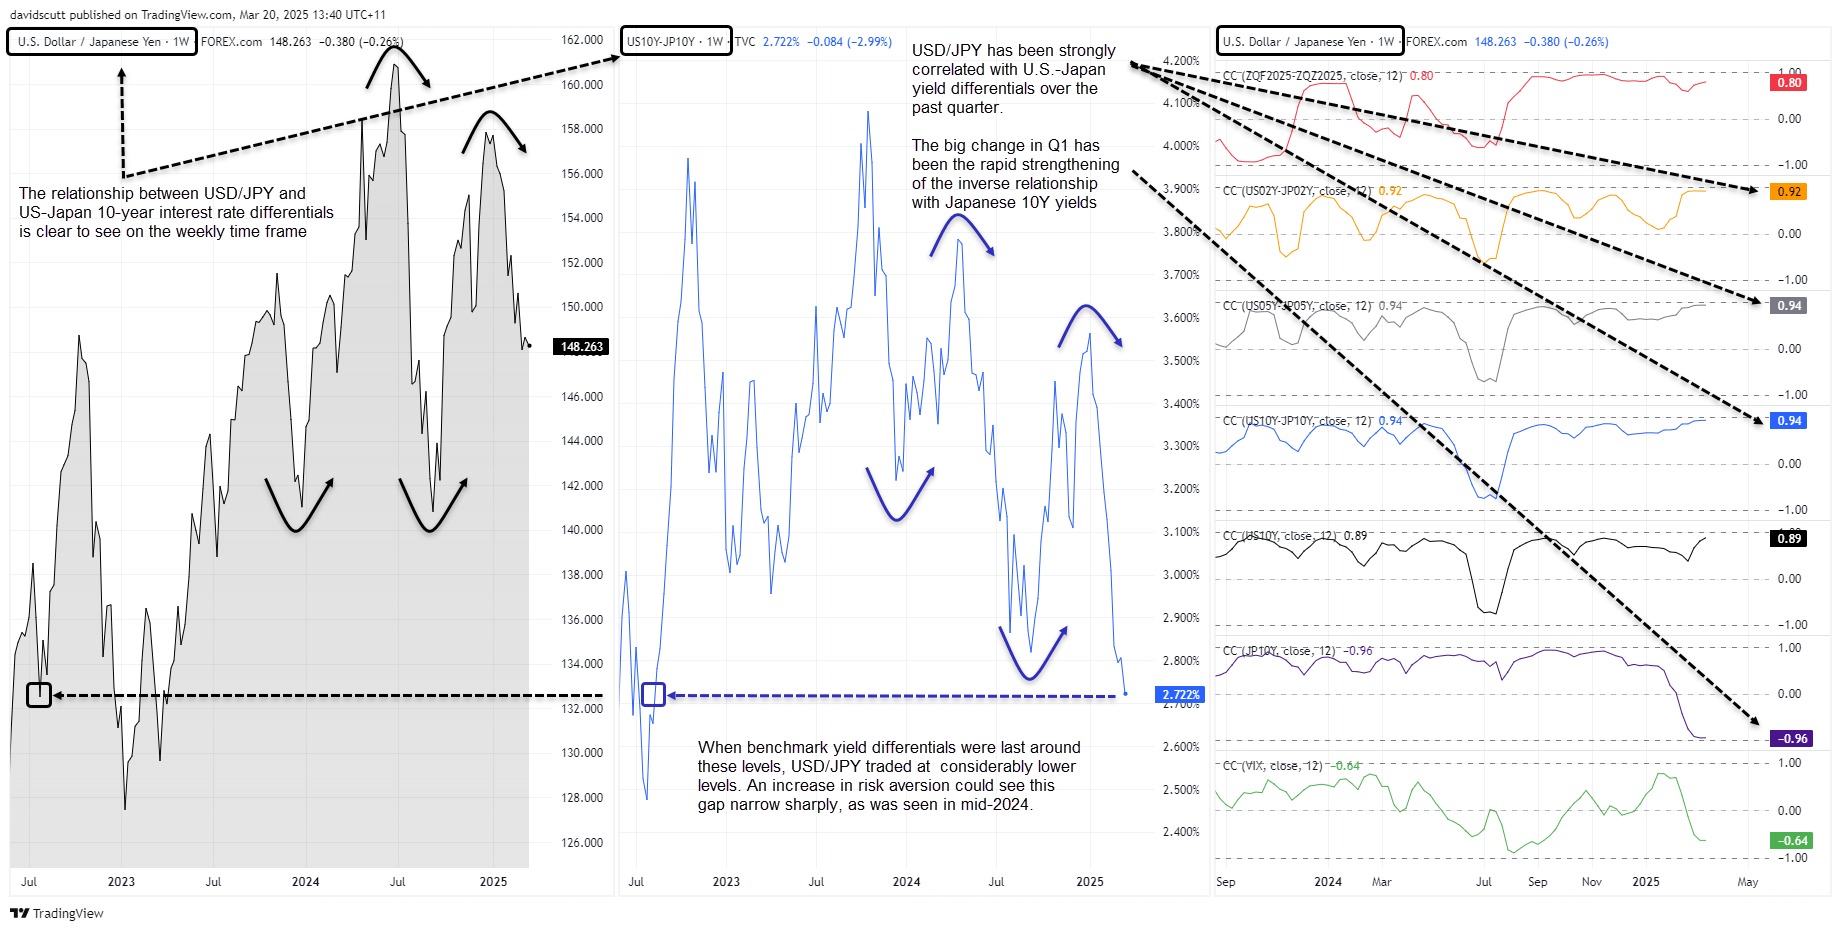
Source: TradingView
Correlation coefficients between the two back this up, with a 0.94 reading over a rolling 12-week basis—identical to the correlation between USD/JPY and five-year yield spreads over the same period. This suggests USD/JPY and rate differentials moved in tandem for most of Q1.
Correlation coefficients measure the strength and direction of a relationship between two variables, ranging from -1 to +1. A reading near +1 means they move together, -1 means they move in opposite directions, and 0 means no relationship. While strong correlations don’t necessarily mean there’s a link, the relationship between rate differentials and USD/JPY fluctuations is well established, particularly through carry trade dynamics.
While USD/JPY continued to show a strong relationship with U.S. 10-year yields, holding a correlation coefficient of 0.89, the big shift in Q1 was the growing inverse correlation with Japanese 10-year bond yields, sitting at -0.96. Having been dominated by the U.S. interest rate outlook for so long, the Japanese outlook has now taken on increased importance for USD/JPY traders.
Another trend to monitor is the increased inverse correlation between USD/JPY and S&P 500 Volatility Index (VIX), implying the yen may have shifted beyond an interest rate play to a proxy for broader risk appetite. Notably, despite the sharp drop in yield spreads, USD/JPY trades significantly higher than when spreads were last around these levels.
The divergence may be explained by the resilience of risk assets, limiting pressure to unwind carry trades despite unfavourable FX moves and rising Japanese borrowing costs earlier this year. However, if narrowing rate differentials were to coincide with a surge in market volatility, it could trigger a sharp USD/JPY decline—similar to early August last year. Past market correlations may not be indicative of future performance.
Trade War Complicates USD/JPY Outlook
Looking ahead, trade tensions add uncertainty to the U.S. and Japanese rate outlooks given the potential impact on inflation, growth, and unemployment. Total trade in goods between the two nations reached around $228 billion last year, with U.S. exports at $79.74 billion and imports from Japan at $148.21 billion. The scale of this relationship makes it hard to gauge the exact implications for USD/JPY.
What is known is Japan’s 10% consumption tax could be applied to Japanese imports entering the U.S. from April 2 under the Trump Administration’s proposed reciprocal tariff policy. Japan’s auto industry is also a prime target for additional tariffs.
From a market reaction standpoint, negative tariff headlines have recently triggered risk-off episodes, leading to USD/JPY weakness. That differs from earlier in the year when such headlines often strengthened the U.S. dollar, including against the yen. It’s unclear how much of the tariff risk is already priced in, making April 2 a potentially volatile and pivotal day for USD/JPY’s medium-term trajectory.
Jobs Market Key for Fed Rates Outlook
Source: Bloomberg
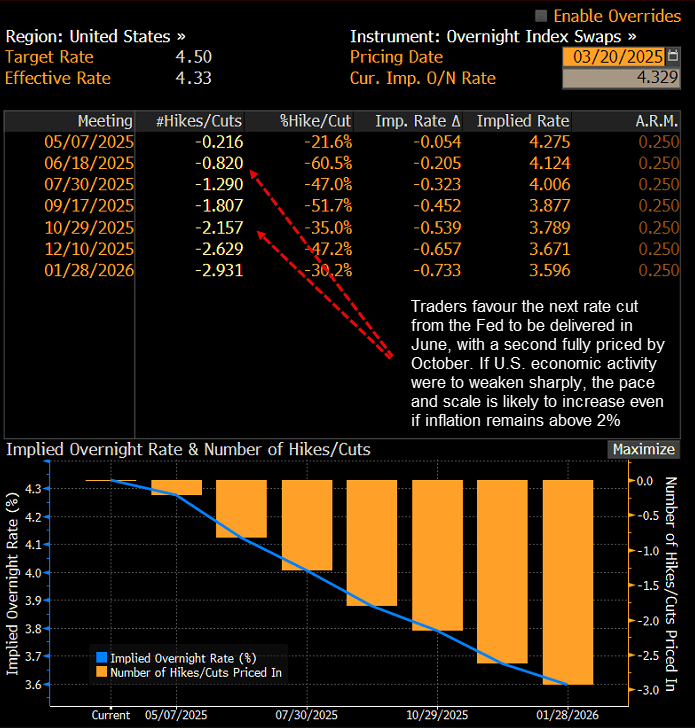
Interest rate swaps show the next 25bp Fed rate cut is not fully priced until July, though a move by June is seen as highly probable. Over the year, two cuts are priced in, with a strong risk of a third.
The March FOMC meeting signalled policymakers view the inflationary impact of tariffs as transitory, implying the Fed will look through any price spikes caused by policy changes. This suggests labour market and economic growth indicators will be more critical in Q2. If rising uncertainty and inflation weaken demand and labour market conditions, the Fed is unlikely to hesitate in cutting rates faster and deeper than markets expect.
BOJ Hikes Hindered by Trade Uncertainty
In Japan, if not for uncertainty from U.S. trade policy, the BOJ would likely follow its January rate hike with another in Q2. Spring wage negotiations delivered the largest increases in decades, providing fuel to boost consumption, keep growth above potential, and sustain inflationary pressures. However, given Japan’s export exposure to the U.S., a major escalation in trade tensions could override domestic considerations.
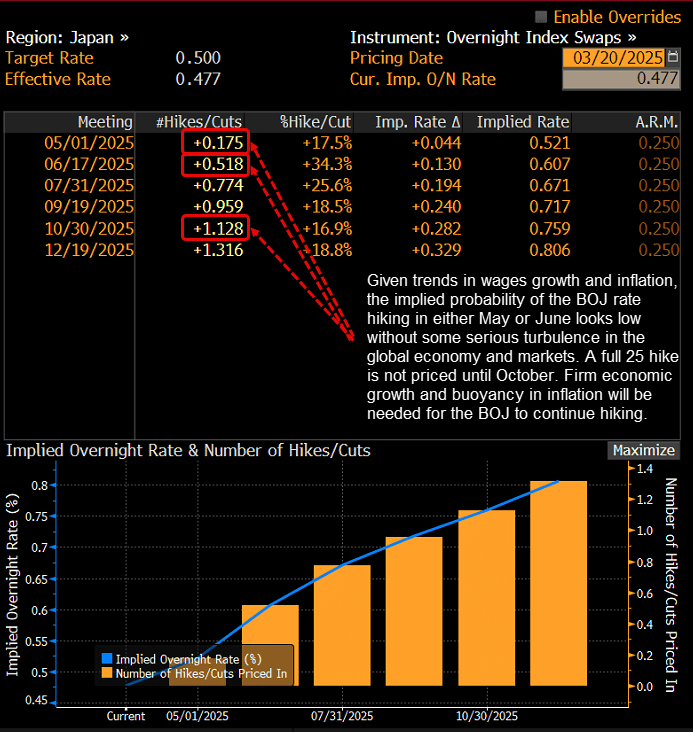
Source: Bloomberg
If trade tensions ease, the implied probability of a 25bp BOJ hike in May or June would rise sharply—unless accompanied by a sudden economic deterioration which seems unlikely in the near term. A full 25bp hike isn’t priced until October, though September is nearly deemed a lock. Key Japanese data releases like inflation, household spending, and GDP, will be crucial in shaping expectations. If they remain firm, the BOJ will likely stay on track to tighten further.
USD/JPY Technical Analysis
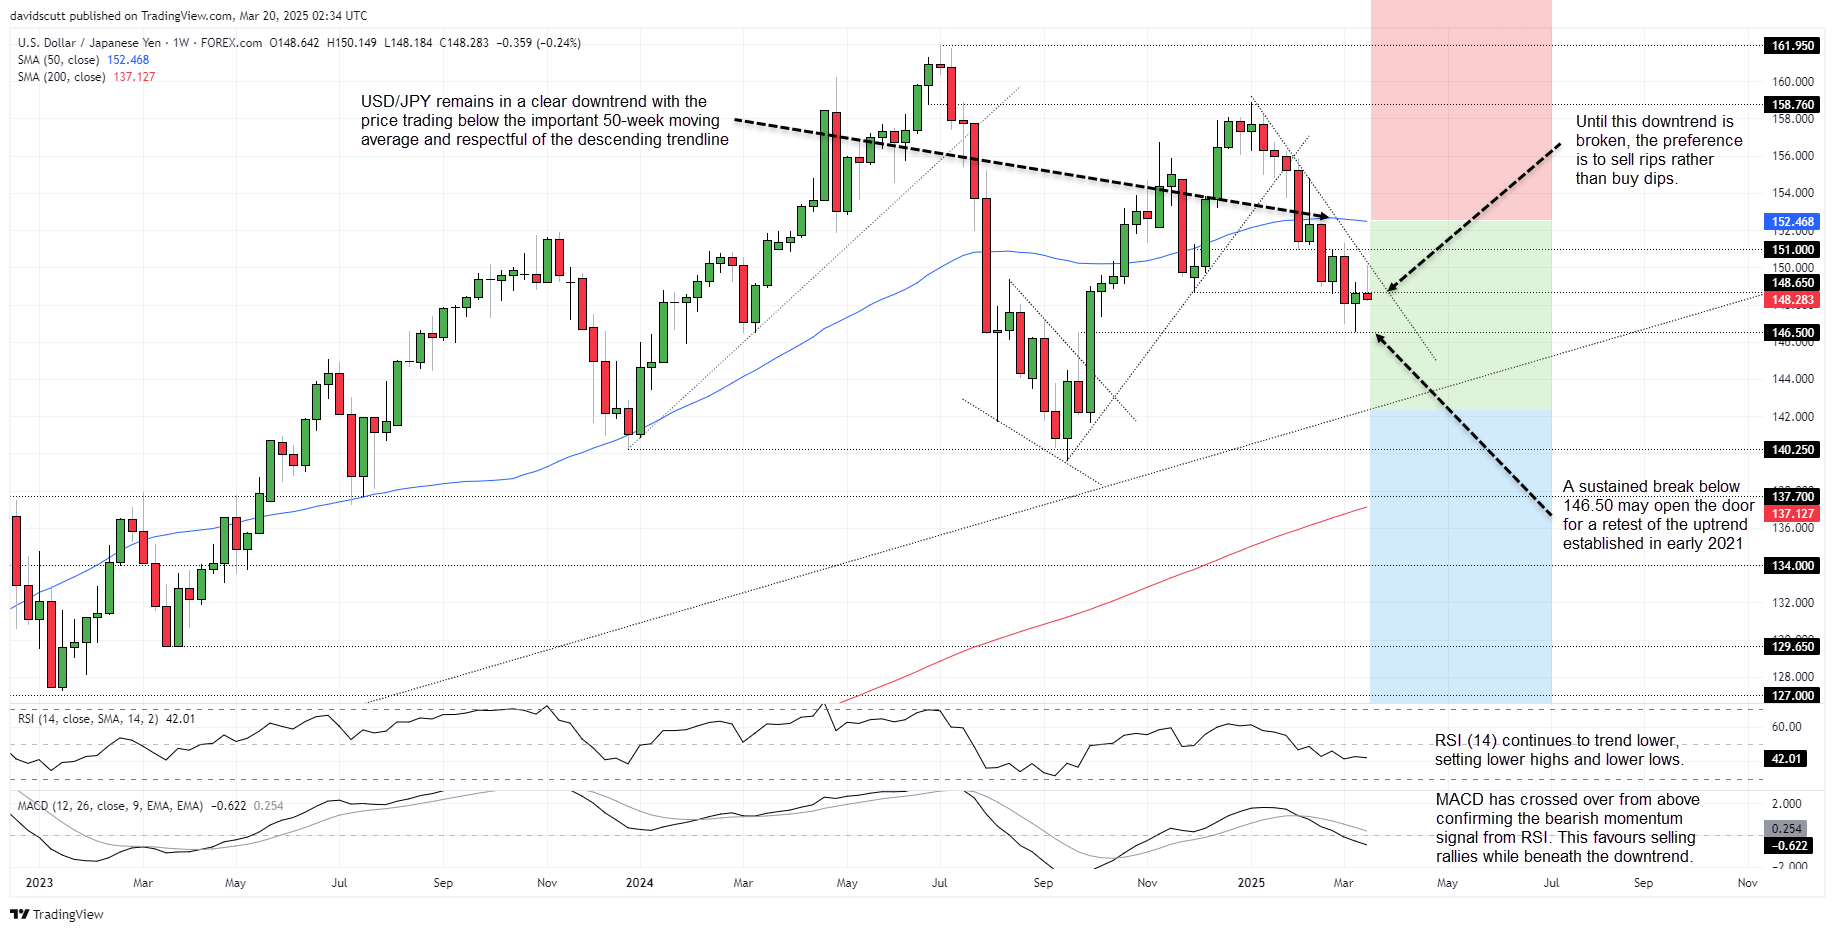
Source: TradingView
Bears remain in control on the USD/JPY weekly chart. The price is in an established downtrend, with momentum indicators like RSI (14) and MACD continuing to trend lower, reinforcing a bearish bias. While the hammer candle that printed in early March hinted at a possible bottom, the follow-up candle reversed much of the move, keeping the bearish bias intact. Until the January 2025 downtrend breaks, the preferred approach remains to sell rallies and downside breaks.
146.50 looms as a key downside level, aligning with where USD/JPY bounced in early March. A break below may see a move towards the uptrend established in early 2021, currently found above 142.00. A breach of that important level would increase the risk of a retest of support at 140.25 or even 137.70.
As for resistance, the December 2024 low of 148.65 remains relevant with the price testing it from above and below without any move managing to stick. Above that, the January 2025 downtrend, horizontal resistance at 151.00, and 50-week moving average are key levels. A break of the latter would open the door for a run back towards the January swing high of 158.76.
USD/JPY Scenario Analysis
To add context to the technical picture, the colour-coding on the chart represents various scenarios that may eventuate in Q2. Each has been assigned a probability reflecting prevailing economic and market trends, along with the highly uncertain outlook.
Risk Appetite, U.S. Economy Heats Up (Red, 10%): Market volatility subsides, U.S. growth reaccelerates, and inflation stays firm, limiting Fed rate cuts. BOJ hike risks are offset by a hawkish U.S. rate outlook.
Uncertainty Prevails (Green, 60%): Trade war escalates but doesn’t cause a global downturn. Stagflation risks limit both the Fed’s ability to cut and the BOJ’s scope to hike, keeping macro conditions and volatility similar to March.
Oh, No! (Blue, 30%): Trade war escalation triggers global downturn, risk-off sentiment surges, and unemployment rises. The Fed cuts aggressively while the BOJ abandons its tightening bias. Carry trade unwinds create asymmetric downside risks.
Written by David Scutt, Market Analyst
Follow David on X: @scutty