

The ASX 200 (Australia 200 index) is poised to close higher for a fifth consecutive week — its best run since December 2023 — fuelled by optimism over softening US data, fading trade war fears, and potential rate cuts from the RBA and Fed. But with prices stalling near February’s intraday record high and technical signs pointing to exhaustion, bulls may want to tread carefully as we head into the weekend.
ASX 200 Technical Outlook: Stretched Rally Meets Resistance as Traders Eye Dips
If a pullback were to materialise, I suspect it could be limited in the current environment. Trump’s trade was is fizzling out, US data is softening to a degree where the Federal Reserve (Fed) might soon consider cutting rates. And economic data in Australia is softening to a degree that could warrant two RBA cuts without fanning fears of a recession.
This content will only appear on Forex websites!
View related analysis:
- US Indices Technical Outlook: Wall Street Bulls Tread Carefully Near Highs
- Nasdaq 100 Leads Wall Street Higher on Consumer Sentiment Rebound
- ASX 200, Hang Seng, Nikkei 225 Futures: Bull Rallies Face Resistance
ASX 200 Technical Analysis (Australia 200): Bearish Pinbar Forms at All-Time High
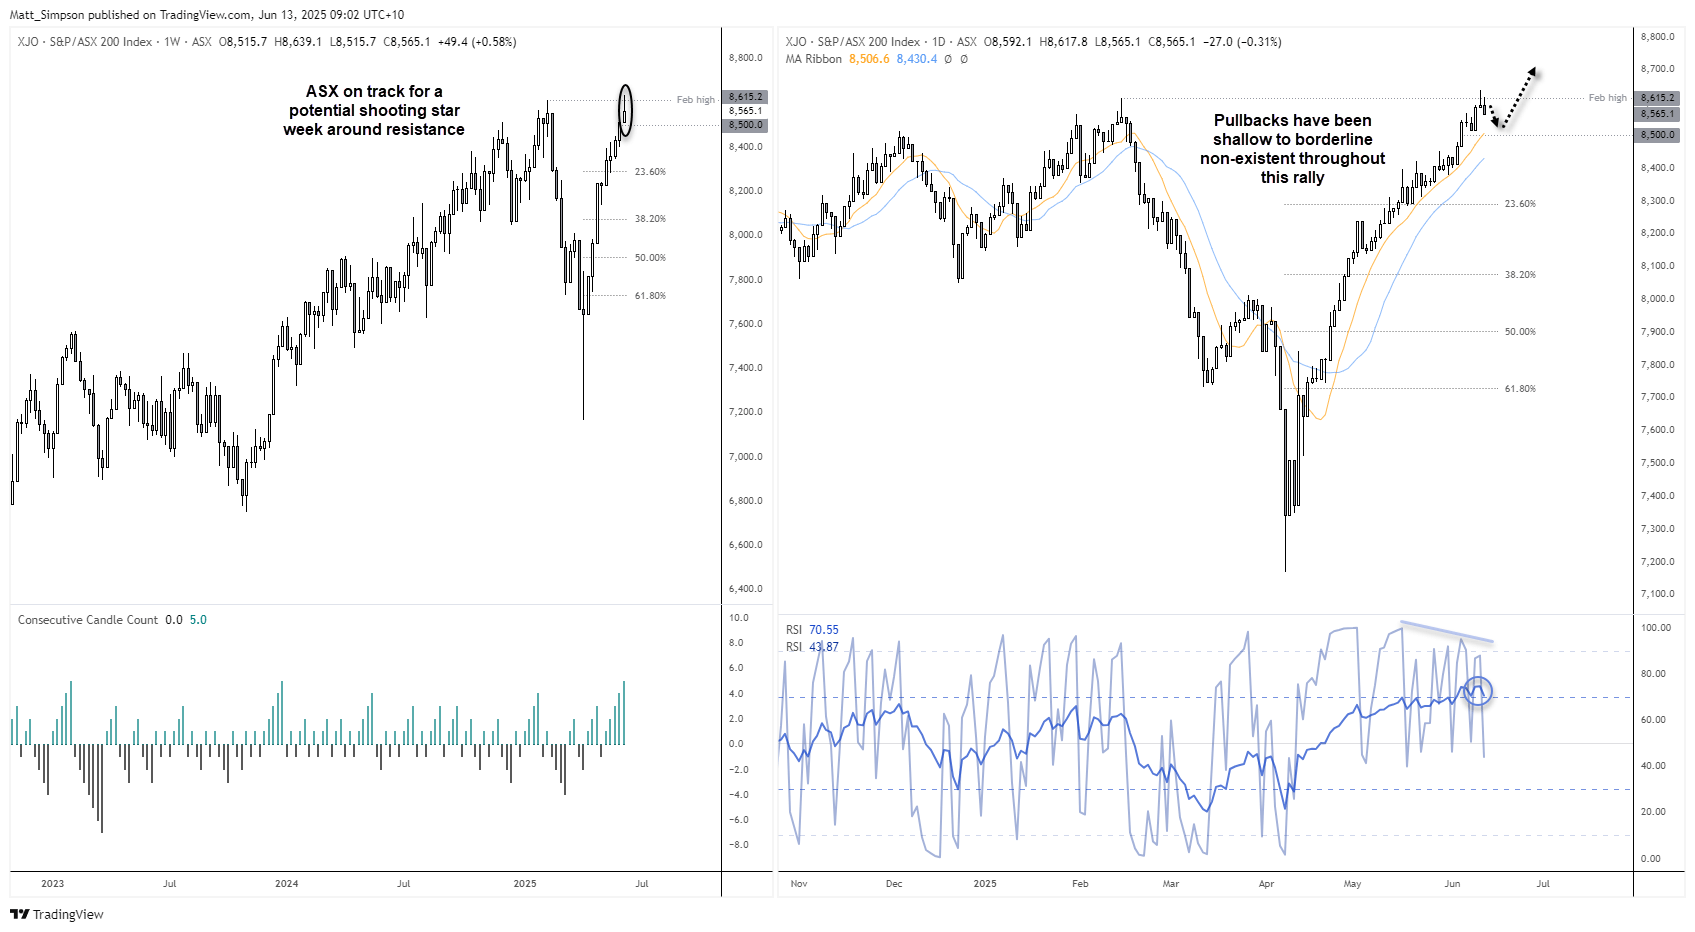
The ASX 200 index reached a record high on a daily-close basis this week, but momentum appears to be stalling beneath the February intraday all-time high (ATH). On the ASX 200 cash market, a bearish pinbar formed on Wednesday after printing a fresh intraday high, only to close back below the key February peak — a classic signal of rejection at resistance.
The daily RSI (14) has remained in overbought territory since June 3, and a bearish divergence is developing on the RSI (2). Together, these indicators warn of a potential near-term pullback in the Australian share market, even as broader sentiment still supports dip buying.
Should prices begin to retrace, the 10-day simple moving average (SMA) around the 8,500 level could act as a logical support zone. That said, pullbacks have been shallow to almost non-existent throughout the current uptrend — suggesting that only a sharp shift in sentiment would alter the prevailing bullish structure.

ASX 200 Futures (SPI 200) Technical Analysis: Bullish Pennant Forms Near Record High
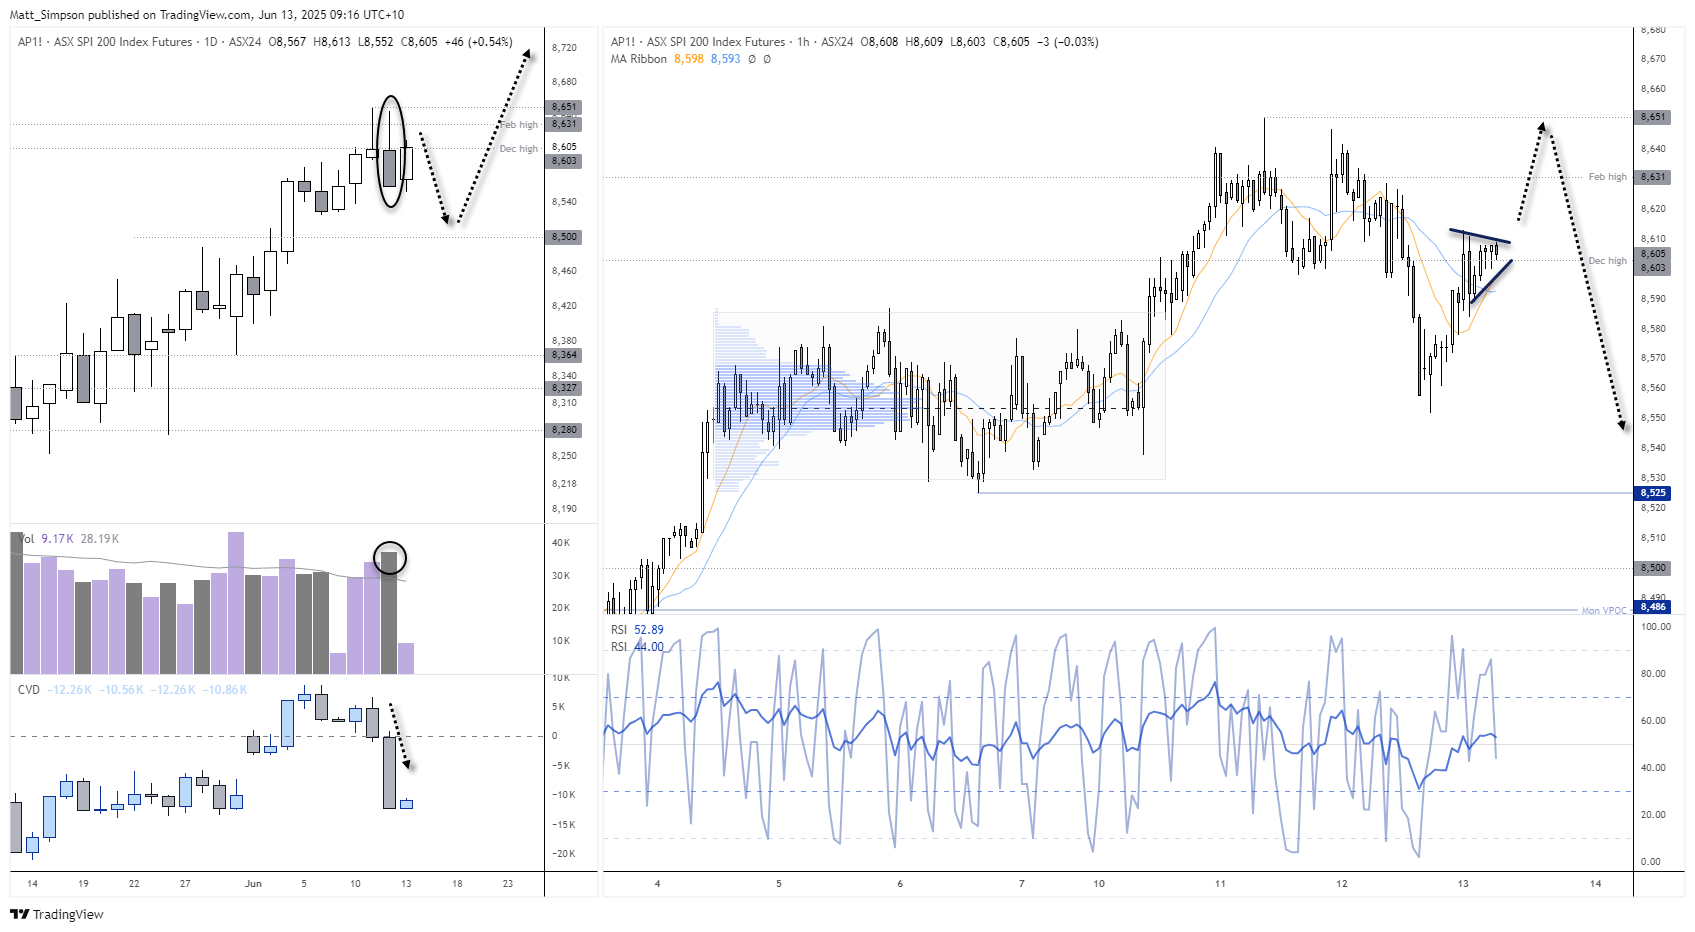
ASX 200 futures (SPI 200) were marginally higher overnight, setting the stage for bulls to potentially challenge the February record high once again. However, trading volumes were notably thin, suggesting limited conviction behind the move. With the February high around 8,631 acting as significant resistance, traders should remain on guard for a false bullish breakout.
Adding to caution, Thursday’s bearish daily candle was accompanied by high volume, a strong negative delta volume (indicating more aggressive sellers than buyers), and a negative cumulative volume delta for the month — all warning signs that buyers are not yet in full control.
The 1-hour chart reveals prices coiling into a bullish pennant pattern, which typically signals an initial upside breakout. Should that scenario unfold, upside targets include the February high (8,631) and the cycle high (8,651).
However, bearish signals from Wall Street indices — including rising wedges on the S&P 500 and Nasdaq 100 futures, and Dow Jones futures stalling at key resistance — suggest this move higher could be a ‘false move’ before a minor pullback.
That said, the broader bias still leans bullish. If ASX 200 breaks to a new high with momentum, traders may favour buying dips or chasing the breakout higher.
-- Written by Matt Simpson
Follow Matt on Twitter @cLeverEdge
Latest market news
September 18, 2025 02:48 PM
June 23, 2025 01:22 PM
June 23, 2025 10:39 AM
June 20, 2025 05:23 PM
June 20, 2025 04:46 PM
June 20, 2025 03:35 PM

June 17, 2025 02:00 PM

June 12, 2025 06:08 AM

May 28, 2025 11:01 AM

May 22, 2025 11:14 AM