Asian equity markets remain technically in bull territory, with strong gains from April lows across the ASX 200, Hang Seng, and Nikkei 225. Yet while all three indices have outperformed in recent weeks, signs of momentum divergence are emerging. The ASX 200 is stalling just shy of record highs, the Nikkei 225 appears to be coiling within a continuation pattern, and the Hang Seng is leading the charge with a cleaner bullish breakout. As key macro data from China, Japan, and Australia cross the wires, traders should stay alert for signs of consolidation or breakout extensions across regional markets.
View related analysis:
- AUD/USD Outlook: Headwinds from China Data and RBA Policy
- US Dollar Outlook: Don’t Write Off the USD Just Yet
- Gold Outlook: Seasonal Weakness and Fading Momentum Hint at June Pullback
- Nasdaq 100 Futures Eye ATH as Wall Street Awaits Trade Headlines
ASX 200 Futures (SPI 200) Technical Analysis
While the ASX 200’s rally from the April low to recent highs is an impressive 19.7%, it still falls just short of the technical 20% threshold that defines a bull market. And if we measure it on a daily-close basis — as is typically done — the gain is reduced to 16.8%. Still, the move is close enough to suggest that ASX bulls are eyeing another run at the February record high of 8,631. That said, a pullback may be due first.
ASX 200 outlook remains constructive, but momentum is clearly slowing. The daily chart shows prices trading in a tight range and struggling to test 8,590, with a bearish divergence on the RSI (2) and a minor one on the RSI (14) within overbought territory. Higher wicks have also formed throughout the range, suggesting bulls are not yet ready to break the ASX 200 higher.
The 1-hour chart reveals a sideways range with a high-volume node (HVN) at 8,554. This could initially provide support, though a break beneath it may open the door to a fall towards the lower bound of the range around 8,530. A break beneath the 8,525 low would suggest a deeper pullback toward the 8,500 handle or the 8,486 VPOC (volume point of control).

Hang Seng Outlook: Rally Outpaces ASX 200 as 24,500 Comes Into Focus
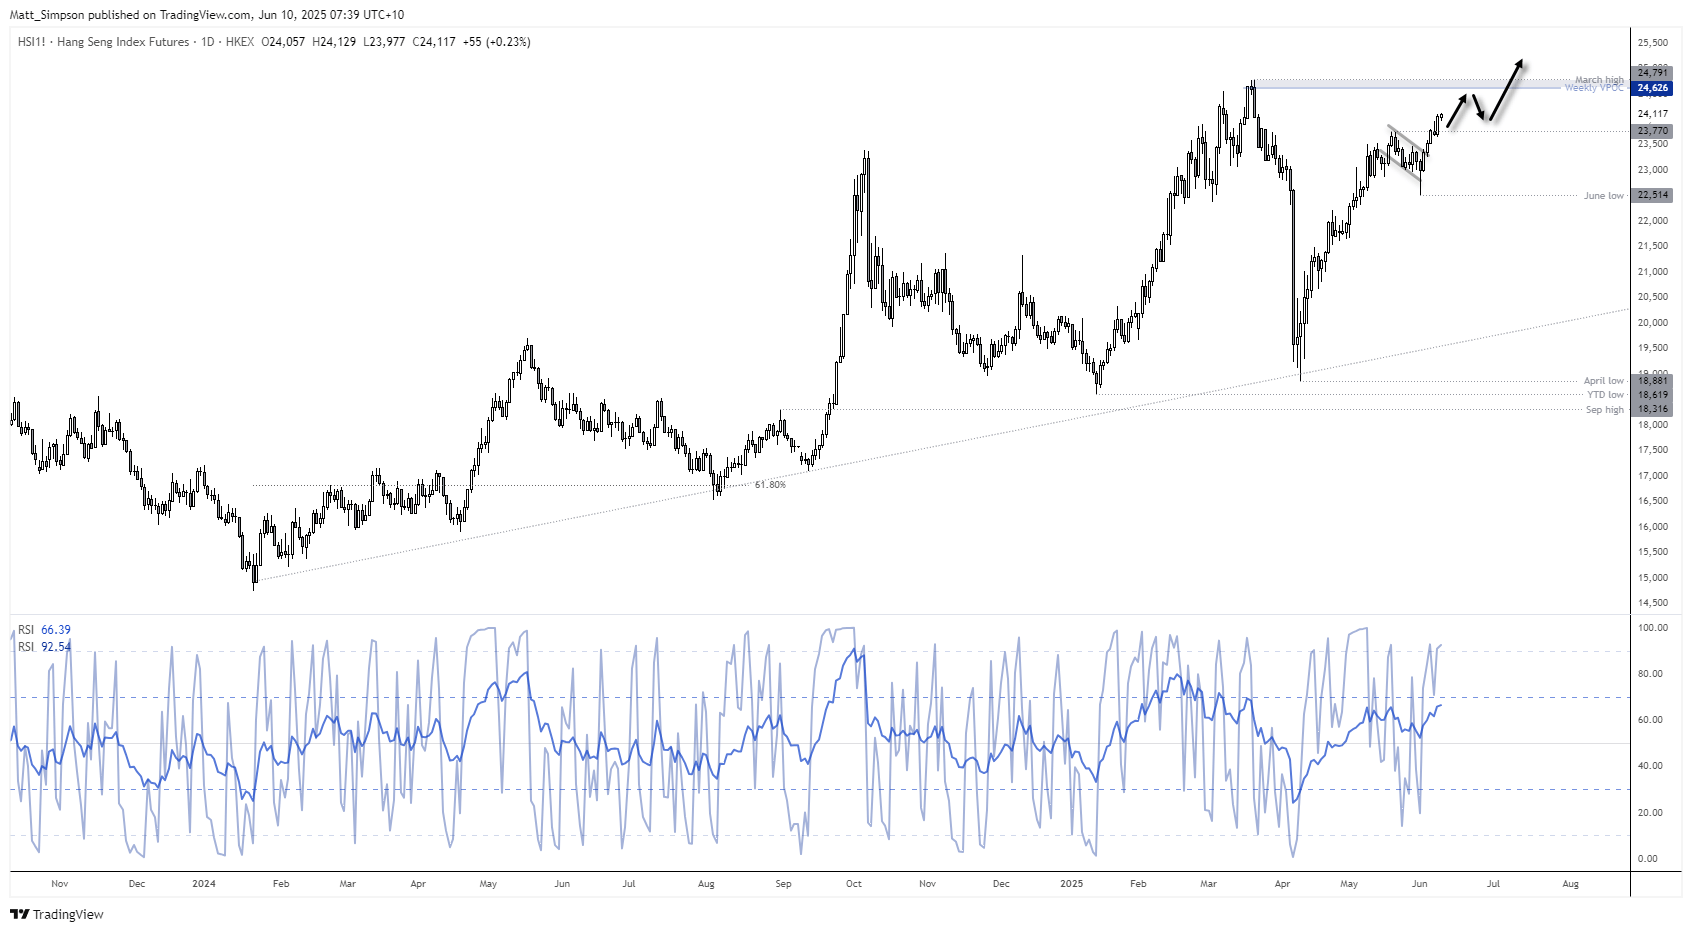
Meanwhile, the Hang Seng entered a technical bull market three weeks ago. Its rally from the April low now stands at 27.8%, making the Hang Seng the outperformer relative to the ASX 200.
Its trend structure also appears more conducive to further gains. Prices broke above a retracement line last Wednesday, and bullish momentum delivered a decisive close above the 23,770 high on Monday. The 24,500 level is now likely in focus for bulls.
Take note of the weekly VPOC at 24,626 and the March high at 24,791, which could prompt a pullback. But overall, it looks like the Hang Seng may eventually break above the March high. Bulls could seek dips towards the 23,770 high.

Nikkei 225 Technical Analysis: Bull Market Holds, But Momentum Stalls
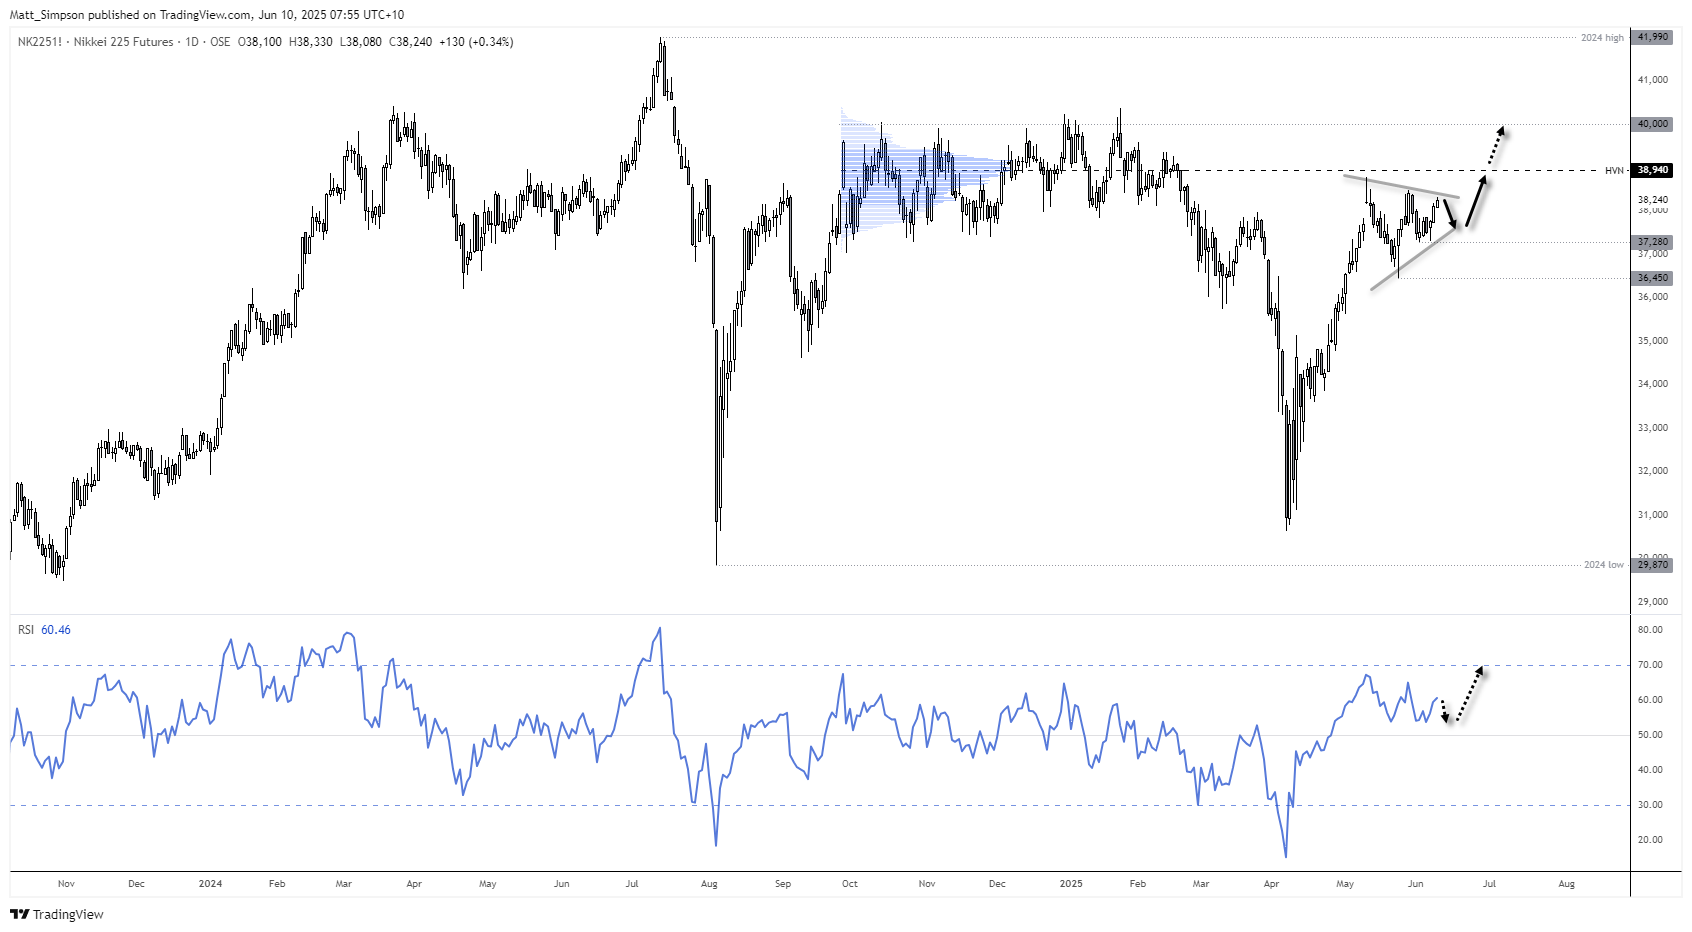
It was the Nikkei that first reached a technical bull market, crossing the 20% threshold over four weeks ago. Its high-to-close rally sits above 26%, though it’s now struggling to break to new highs — hinting at near-term weakness. That said, a potential continuation triangle could be forming, although it may also allow for a recycle or two lower before the trend resumes higher.
The high-volume node at 38,940 could serve as a near-term upside target for bulls, with a break above it bringing the 40,000 level into focus. But given the strength of the broader trend and signs of near-term weakness, bulls may want to seek dips while prices remain above the May low.

Economic Events in Focus (AEST / GMT+10)
- 09:01: GBP BRC Retail Sales Monitor (May) (GBP/USD, GBP/JPY, FTSE 100)
- 09:50: JPY M2 Money Stock, M3 Money Supply (USD/JPY, EUR/JPY, Nikkei 225)
- 10:30: AUD Westpac Consumer Sentiment (Jun) (AUD/USD, ASX 200)
- 11:30: AUD NAB Business Confidence, Business Survey (May) (AUD/USD, ASX 200)
- 16:00: GBP Average Earnings, Employment Data, Unemployment Rate (Apr/May) (GBP/USD, GBP/JPY, EUR/GBP, FTSE 100)
- 16:00: JPY Machine Tool Orders (May) (USD/JPY, Nikkei 225)
- 17:00: CHF SECO Consumer Climate (May) (USD/CHF, CHF/JPY, EUR/CHF)
- 18:30: EUR Sentix Investor Confidence (Jun) (EUR/USD, EUR/GBP, EUR/JPY, DAX)
- 20:00: USD NFIB Small Business Optimism (May) (USD, S&P 500, Nasdaq 100, Dow Jones)
- 02:00: USD EIA Short-Term Energy Outlook (USD, WTI Crude Oil, Natural Gas Futures)
- 03:00: USD 3-Year Note Auction (USD, US Treasury Yields)
View the full economic calendar
-- Written by Matt Simpson
Follow Matt on Twitter @cLeverEdge


