

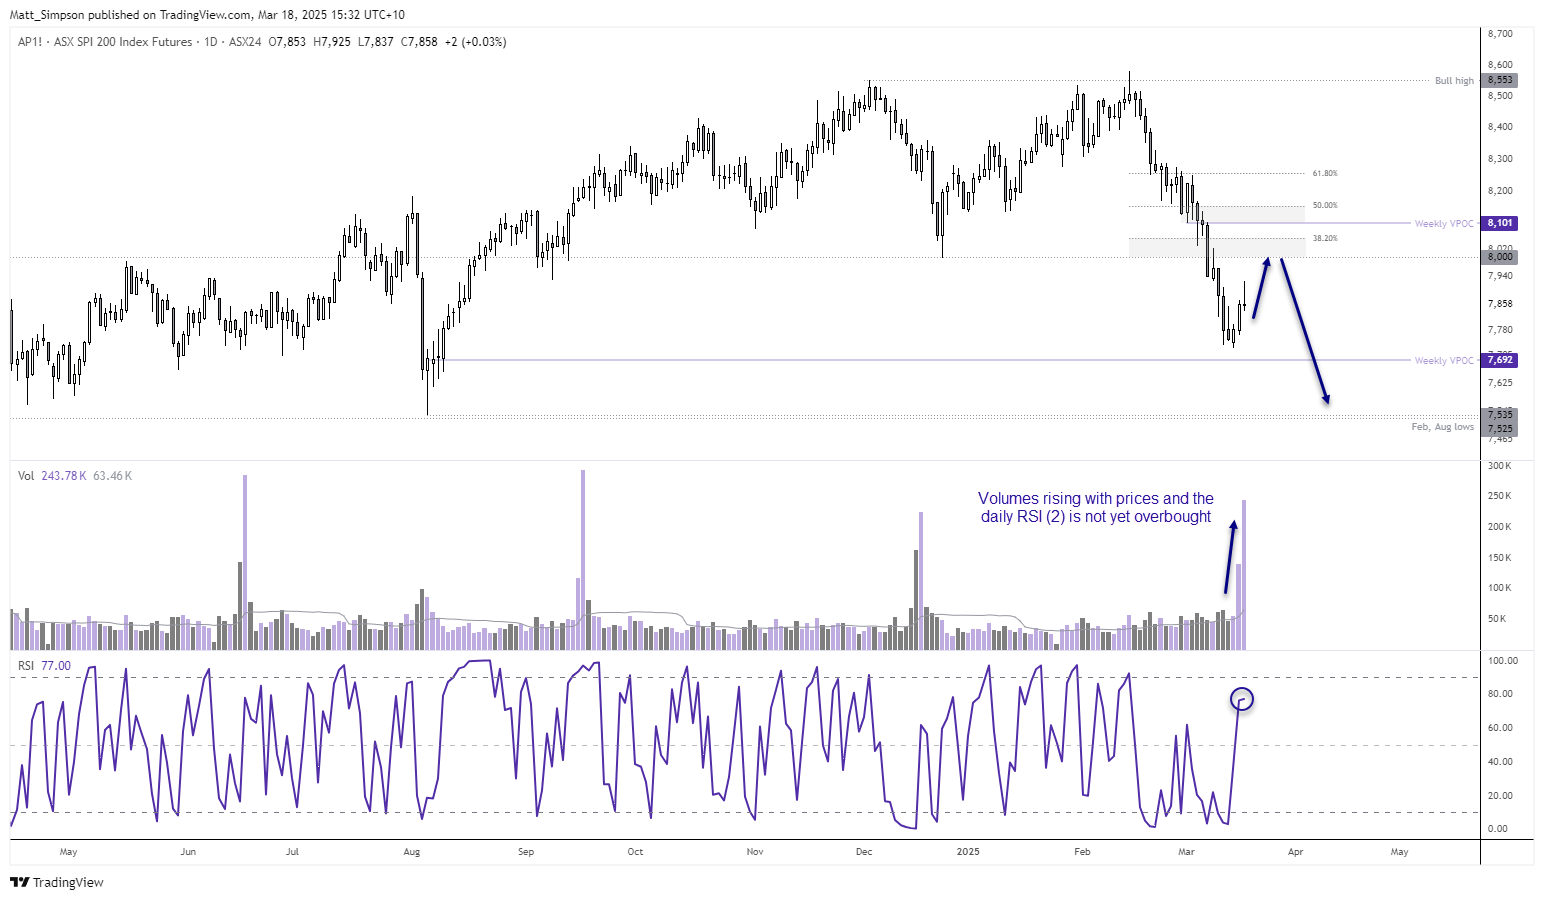
ASX 200 futures (SPI 200) technical analysis – weekly chart
The ASX 200 has fallen alongside Wall Street for the past four weeks, to mark its most bearish run in one year. And at this stage I can only assume that there could be further losses to eventuate, given that volumes are rising while prices decline.
But there are some suggests that some stability is already underway. Last week’s low found support at the 100-week SMA, just as last week’s weekly RSI (2) reached its most oversold level since March 2023. So perhaps bears can look forward to fading into a bounce in due course.
Beyond that, a break of last week’s low brings the February and August lows into focus around 7350, and the 200-day SMA at 7428.


ASX 200 futures (SPI 200) technical analysis – daily chart
A counter trend move for the ASX is already underway and shows promise, with daily trading volumes picking up notably. Monday’s bullish range expansion candle was at the time the highest daily volume of the year, and today’s volume has already exceeded yesterday’s level of trade.
While the current daily candle has formed a shooting star reversal, the day is yet to full close. The daily RSI (2) is also not yet overbought, which could bring the 8,200 level or weekly VPOC (volume point of control) into focus around 8100 over the near term.
Of course, bears will no doubt be laying in wait seeking evidence of a swing high on the daily chart to rejoin the anticipated move lower, to its 200-day SMA further out.

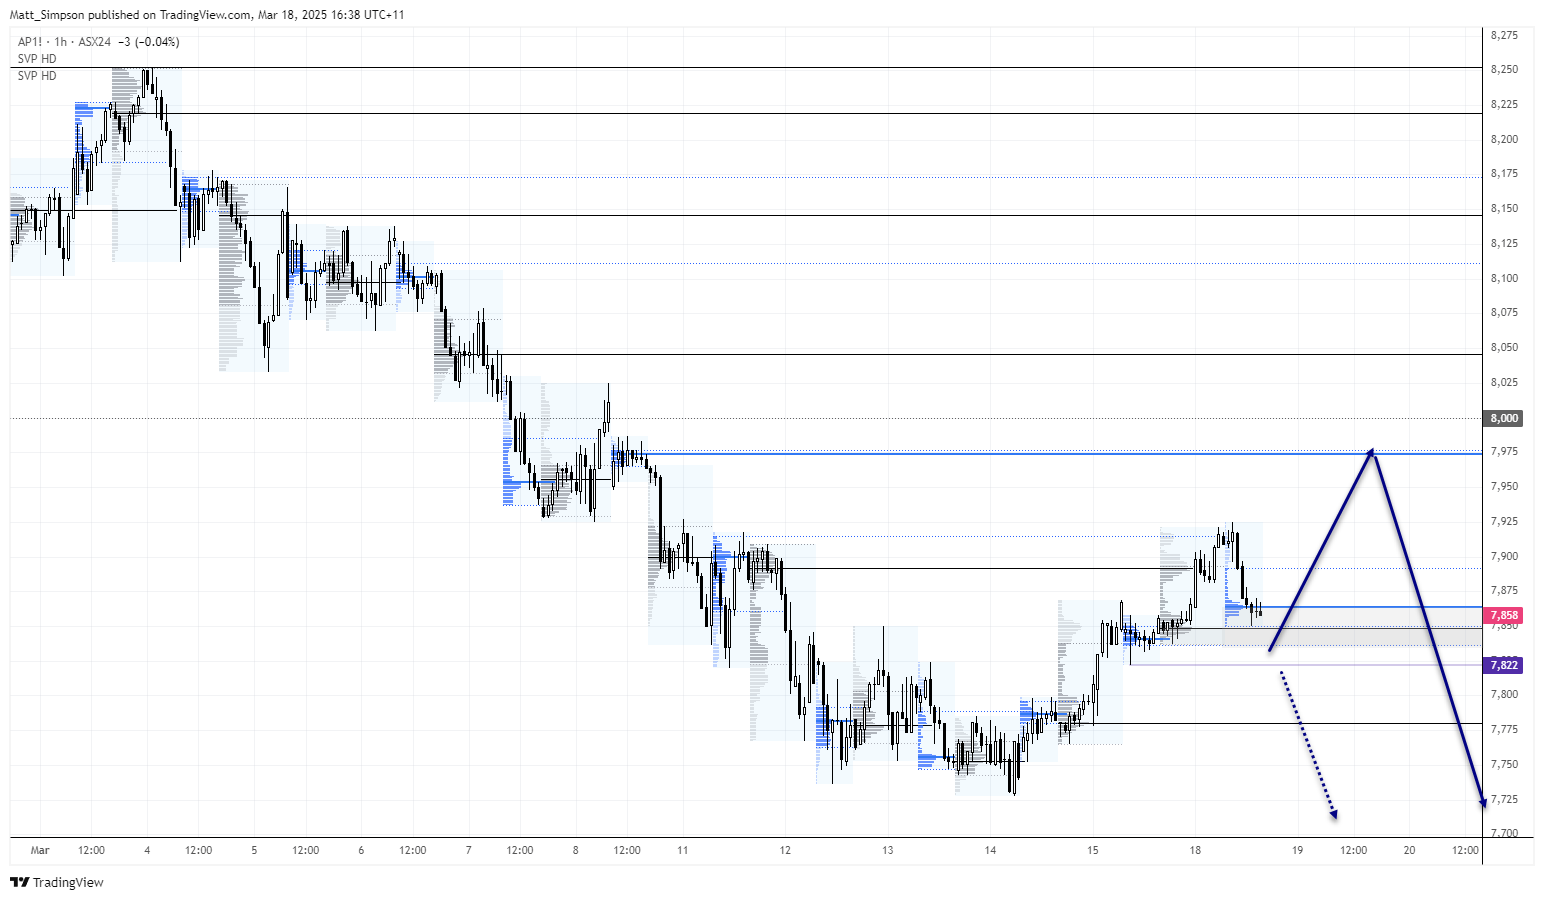
ASX 200 futures (SPI 200) technical analysis – 1-hour chart
The 1-hour chart shows the daily volume profiles of each ASX day session (blue) and night session (grey). Today’s day session low has found support at Monday’s overnight VPOC (volume point of control) of 7489, with the overnight low of 7836 also nearby for potential support.
For now, the intraday bias remains bullish while prices hold above the 7822 swing low and for a move to the 7975 – 8000 resistance zone. A break beneath 7800 suggests the minor rebound from cycle lows may have completed, and we can refer to higher timeframe analysis for bearish targets.
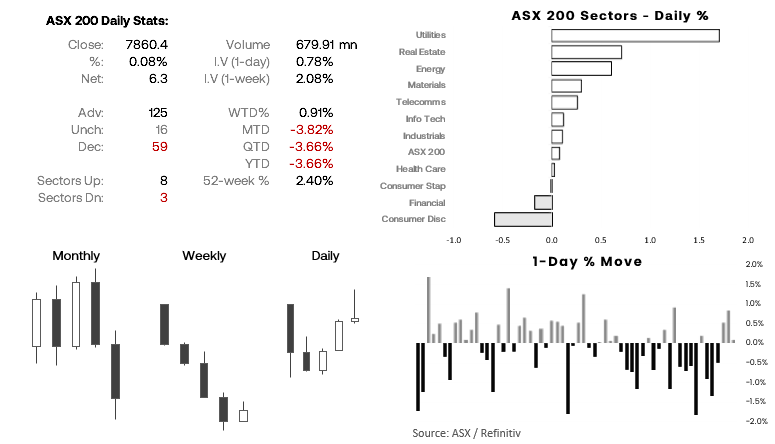
ASX 200 cash index at a glance
-- Written by Matt Simpson
Follow Matt on Twitter @cLeverEdge
Latest market news

April 25, 2025 02:58 AM