

View related analysis:
- Tentative Signs of a US Dollar Rebound Ahead of Powell speech
- Japanese Yen Analysis: USD/JPY, CAD/JPY, AUD/JPY Price Action Setups
- AUD/USD Rebound Stalls Near 64c, 200-day EMA; PMIs In Focus
- ASX 200 Hang Seng Analysis: Bears Shaken Out From Wall Street Surge
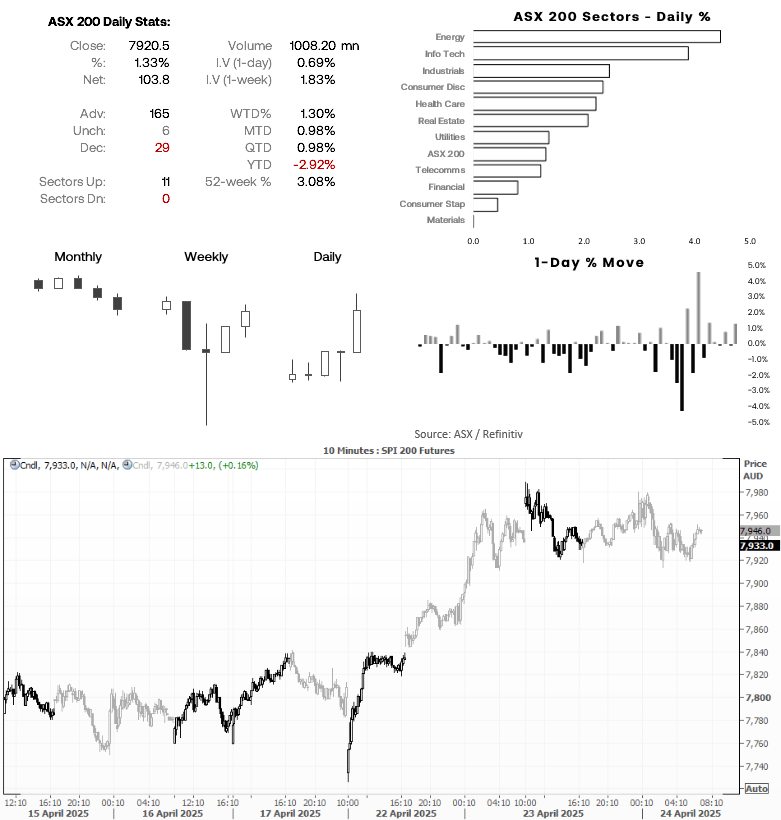
S&P/ASX 200 Index at a Glance (April 23)
- 165 stocks advanced on the S&P/ASX 200 on Wednesday (82.5%), 29 declined (14.5%) and 6 were unchanged (3%) on Tuesday
- All 11 S&P/ASX 200 sectors advanced, led by energy and information technology while materials and consumer staples lagged
- Its 1.3% gain on Tuesday saw the S&P/ASX 200 cash index close to a 13-day high
- However, resistance levels hover nearby at the 8,000 handle, 8015 (march high) and 8051 (December low)
S&P/ASX 200 Technical Analysis
The ASX 200 has risen over since the April low, yet with Wall Street indices seemingly hesitant to extend their Tariff-optimism gains on Wednesday, ASX traders should take note at resistance levels nearby. Not only for the AX cash market, but on the ASX 200 futures market as well (SPI 200).
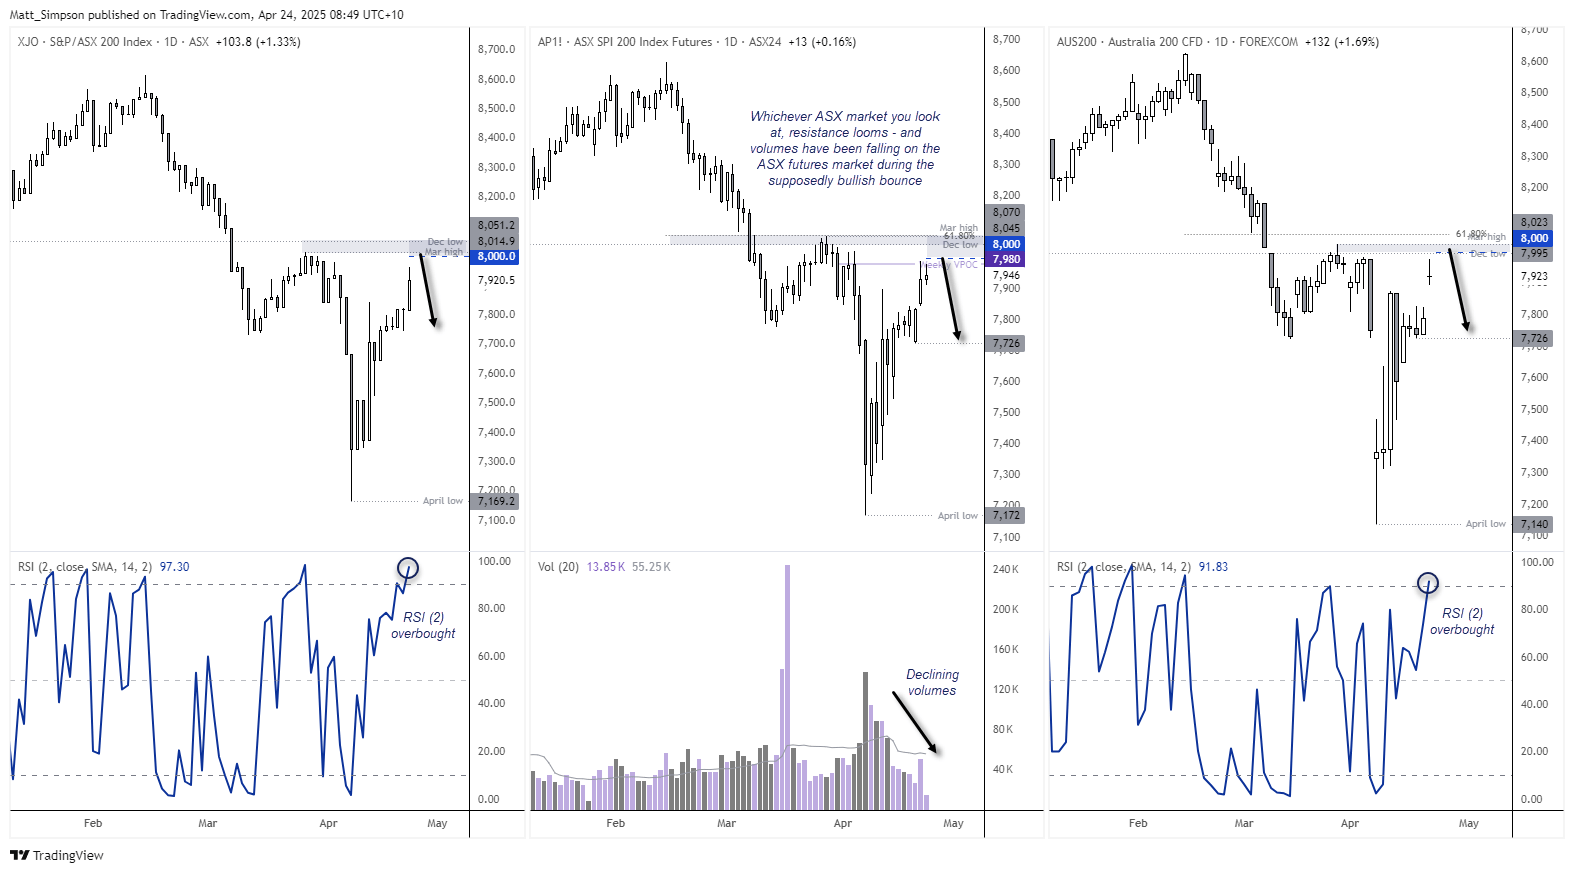
ASX 200 Cash Index
The cash index is expected to open slightly higher, with ASX futures rising 0.16% overnight. Yet the 8,000 handle looms overhead, just beneath the March high and December low. The daily RSI (2) is also overbought to suggest the ASX is rally is stretched over the near term.
ASX 200 Futures (SPI 200)
The rally on ASX futures has stalled almost perfectly at a historical weekly VPOC (volume point of control), which itself is just shy of the 8,000 handle. Given that the rally has also coincided with diminishing daily trading volumes also suggests the bounce could be corrective. With that said, it is not uncommon for a bounce to materialise on low volumes after a sharp decline as bulls with burned fingers remain sidelined.
Still, with several key resistance levels nearby, my personal preference would to fade into moves towards resistance. Bears could target the 7726 swing low, a break beneath opens up a run for 7500.
AUS200 – Australia 200
This could paint limited upside for the AUS200. Using analysis from the ASX cash and futures markets, bears could seek to fadea into moves towards the 8,000 and use a break above the 61.8% Fibonacci level (8055) to invalidate the near-term bearish bias. A break below 7800 brings the 7726 low into focus, a break beneath which also opens up a run for 7500.

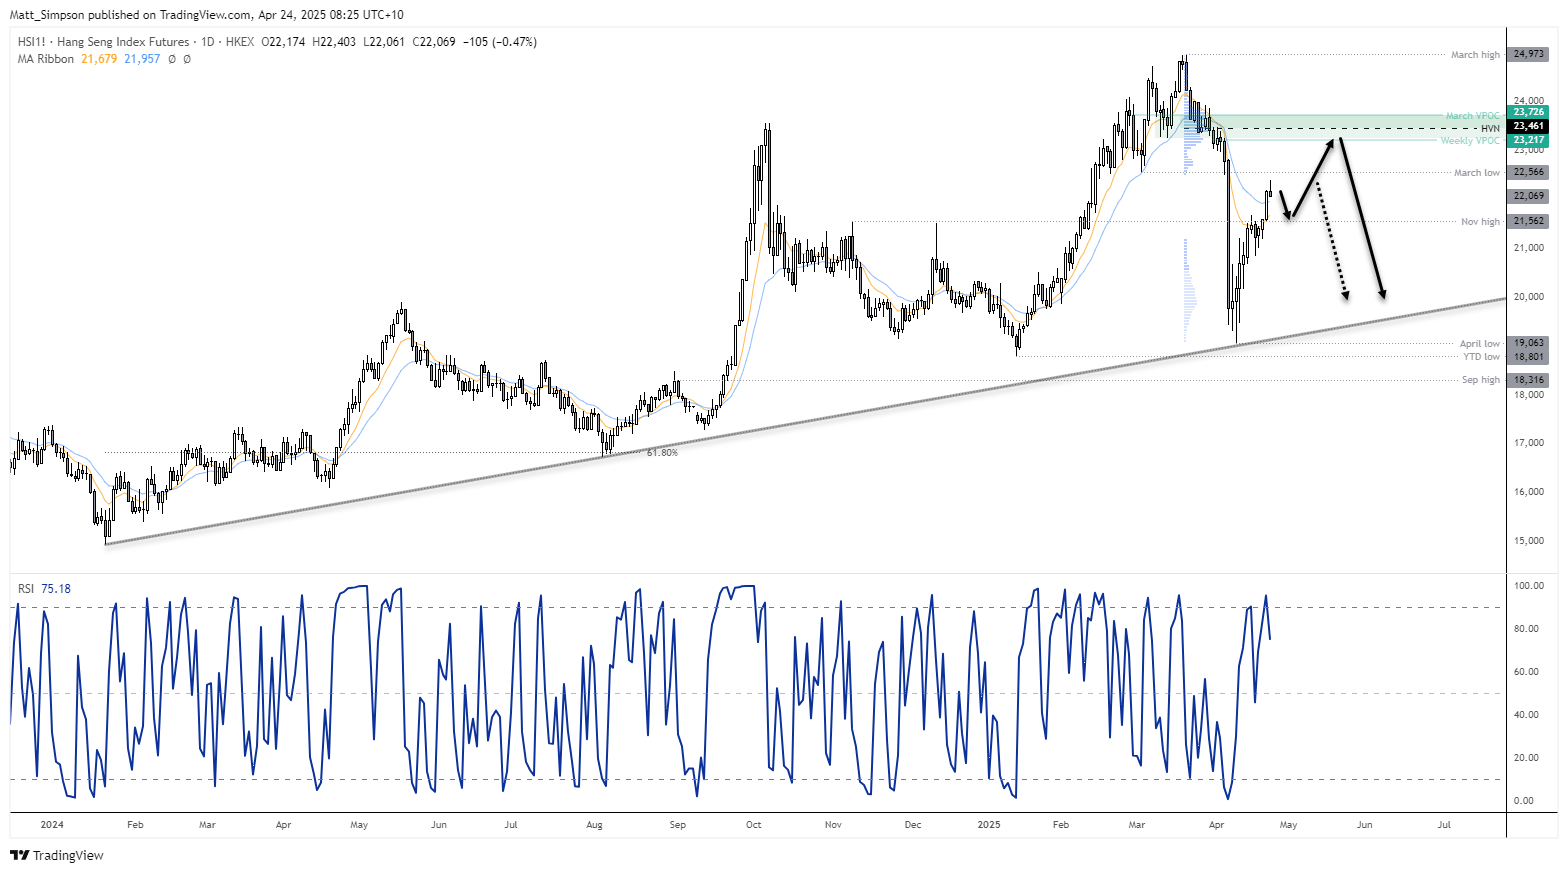
Hang Seng Futures (HSI) Technical Analysis
After a 24% decline from the March high in just 13 trading days, Hang Seng futures found support at the January 2024 trendline, just above 19,000. The market has since rebounded 17.5%, and bulls look like they have more to give.
Wednesday’s bullish range expansion day broke out of consolidation and back above the November high, and is less than a day’s typical trading range away from retesting the March low. With prices back above the 10- and 20-day EMAs, and the moving averages turning higher, the preference remains for bulls to seek dips for a move to 20,500. And as the daily RSI (2) reached overbought on Wednesday, a swing low could potentially form around the 10-day EMA and November low, near 21,500, should prices initially retrace lower.
A break above the March low (22,566) brings the weekly and March VPOCs into focus at 22,217 and 23,726 respectively. Also note the high-volume node (HVN) spanning the March high to April low at 23,461, which could also act as a magnet for prices.
Of course, should sentiment around trade optimism sour once more, global indices could be vulnerable to another leg lower. Hang Seng traders should therefore be mindful of a potential swing high around the March high or the volume cluster above 23,000.
-- Written by Matt Simpson
Follow Matt on Twitter @cLeverEdge
Latest market news
September 18, 2025 02:48 PM
June 23, 2025 01:22 PM
June 23, 2025 10:39 AM
June 20, 2025 05:23 PM
June 20, 2025 04:46 PM
June 20, 2025 03:35 PM

June 17, 2025 02:00 PM

June 12, 2025 06:08 AM

May 28, 2025 11:01 AM

May 22, 2025 11:14 AM