

Weekly Technical Trade Levels on USD Majors, Commodities & Stocks
- Technical setups we are tracking into the weekly open
- Next Weekly Strategy Webinar: Monday, June 16 at 8:30am EST
- Review the latest Video Updates or Stream Live on my YouTube playlist.
In this webinar we take an in-depth look at the technical trade levels for the US Dollar (DXY), Euro (EUR/USD), British Pound (GBP/USD), Australian Dollar (AUD/USD), Canadian Dollar (USD/CAD), Japanese Yen (USD/JPY), Swiss Franc (USD/CHF), Gold (XAU/USD), Silver (XAG/USD), Crude Oil (WTI), S&P 500 (SPX500), Nasdaq (NDX), Dow Jones (DJI), and Bitcoin (BTC/USD). These are the levels that matter on the technical charts into the weekly open.
Australian Dollar Price Chart – AUD/USD Weekly
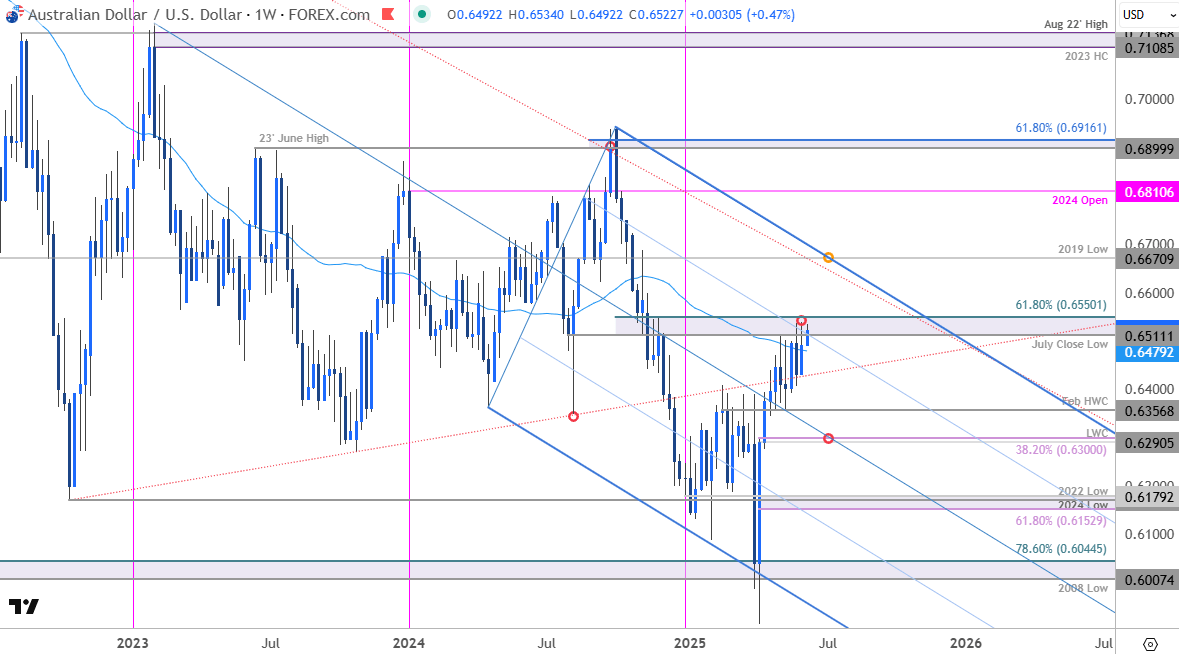
Chart Prepared by Michael Boutros, Sr. Technical Strategist; AUD/USD on TradingView
Aussie is trading into a critical resistance range into the start of the week at 6511/50- a region defined by the July close low and the 61.8% retracement of the 2024 decline. Note that the 75% parallel converges on this threshold this week – looking for possible inflection here with the near-term rally vulnerable while below.
A topside breach exposes a potential run towards the upper parallel / 2019 low at 6670. Initial support rests with the February high-week close (HWC) at 6357 with a break / close below the low-week close (LWC) / 38.2% retracement of the yearly range at 6290-6300 needed to mark resumption of the broader downtrend. Review my latest Australian Dollar Short-term Outlook for a closer look at the near-term AUD/USD technical trade levels.

Oil Price Chart – WTI Daily
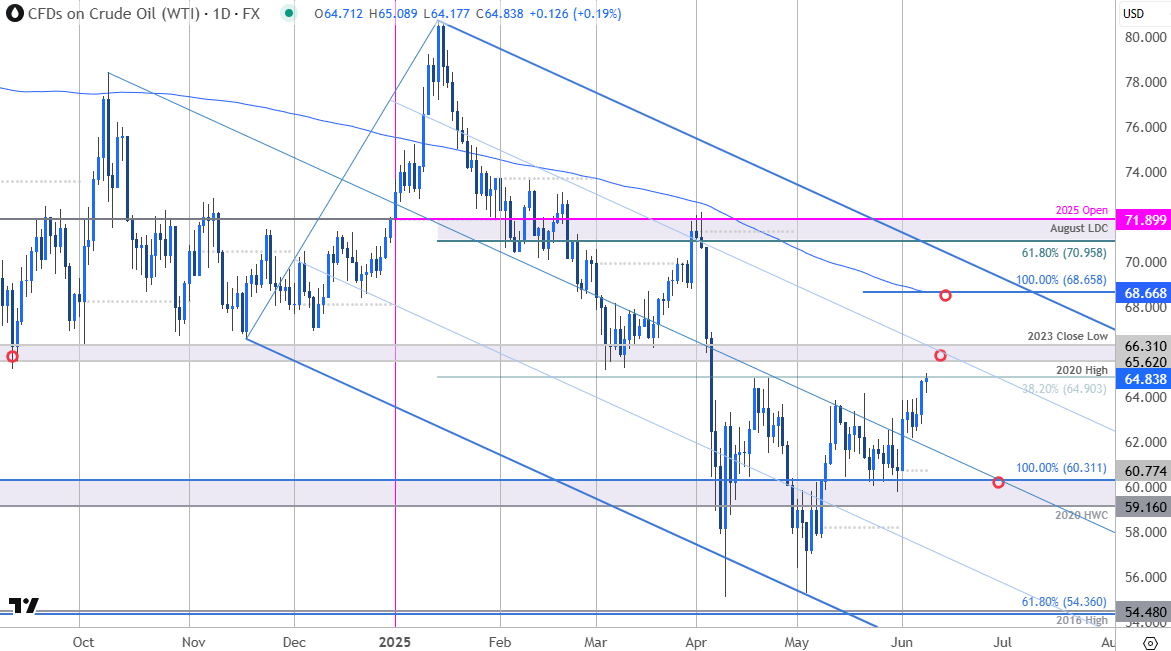
Chart Prepared by Michael Boutros, Technical Strategist; WTI on TradingView
Oil prices have rallied more than 18.1% off the yearly lows with WTI testing initial resistance today at the April swing high / 38.2% retracement of the yearly range at 64.90. A critical resistance pivot is eye just higher at the 2020 high / 2023 close low at 65.62-66.31. Note that the 75% parallel of the yearly downtrend converges on this zone and further highlights the technical significance of this threshold in the days ahead. Risk for possible price inflection / exhaustion into this region IF reached with the multi-week advance vulnerable while below.
A topside breach exposes the 200-day moving average / 100% extension of the May advance near 68.65 and the upper parallel. Broader bearish invalidation remains with the 61.8% retracement / 2025 yearly open at 70.95-71.90. Initial support rest with the median-line (currently ~61.75) and is backed by the monthly open at 60.77. A close below the 2020 high-week close (HWC) at 59.16 is needed to mark resumption of the broader downtrend.
Economic Calendar – Key USD Data Releases
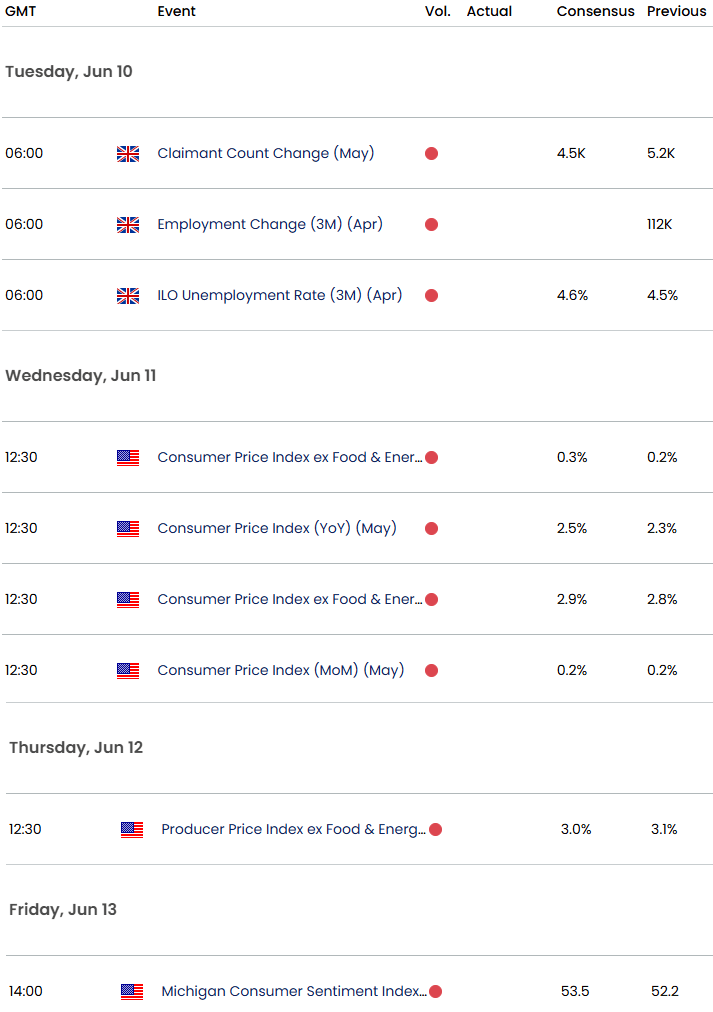
Economic Calendar - latest economic developments and upcoming event risk.
--- Written by Michael Boutros, Sr Technical Strategist
Follow Michael on X @MBForex
Latest market news
September 18, 2025 02:48 PM
June 23, 2025 01:22 PM
June 23, 2025 10:39 AM
June 20, 2025 05:23 PM
June 20, 2025 04:46 PM
June 20, 2025 03:35 PM

June 9, 2025 09:32 AM

May 12, 2025 06:44 AM
April 27, 2025 02:00 PM