

Last week’s employment figurers for Australia were surprisingly weak, with the -53k jobs reduction missing the +31k forecast by a whopping -84k. This saw the participation rate fall from its record high and drag the employment-to-population rate lower. However, it seems unlikely to tip the RBA’s hand into an immediate cut, as much of the weakness can be explained by older workers retiring.

Whether the RBA cut in Q2 or Q3 could come down to the quarterly inflation figures released on the 30th April. But traders will of course keep a close eye on the monthly inflation report released Wednesday. While four of the headline measures (CPI, median, trimmed mean and volatile items less travel) are all within the RBA’s 2-3% band, they are curling higher. But then the basing effect should be taken into account, given they have all been trending lower for two years.
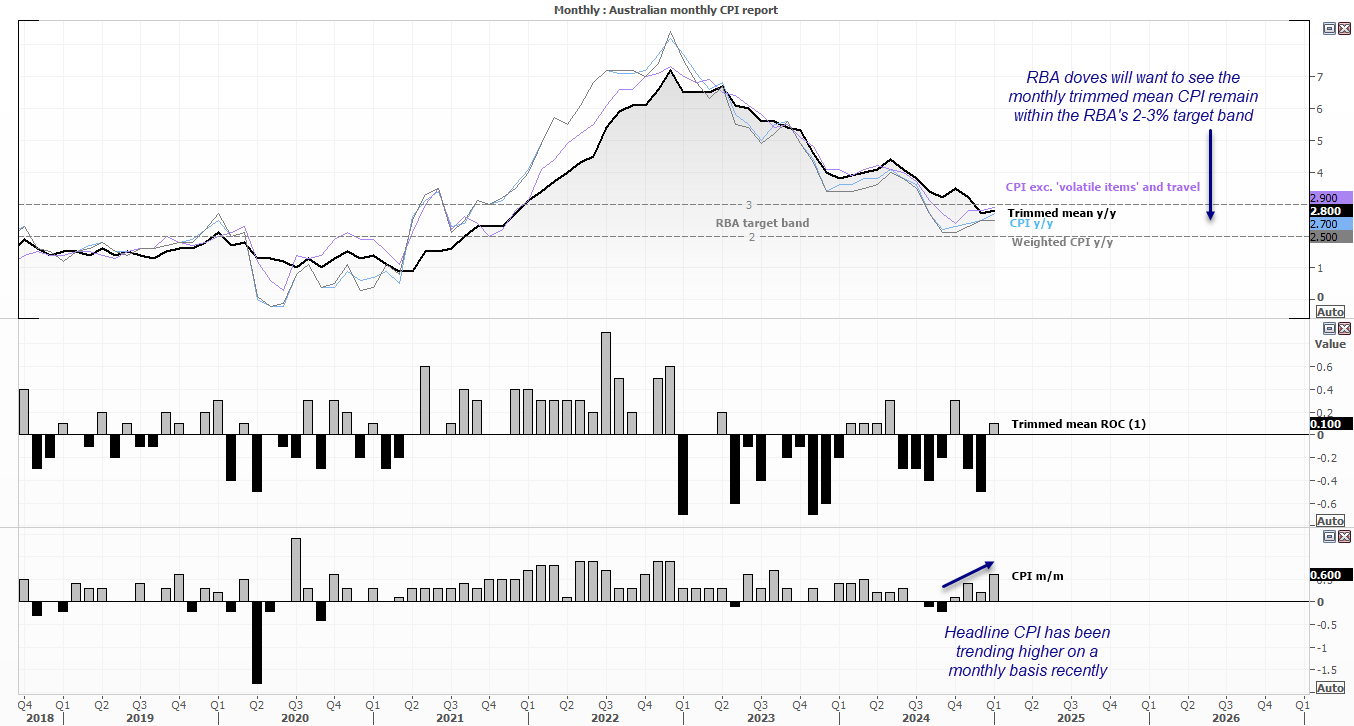

With the monthly trimmed mean at 2.8% y/y and the quarterly trimmed mean at 3.2%, doves will want to see the annual trimmed mean to remain within the 2-3% band to avoid panic. A print of 2.7% or lower could soothe any concerns and spark hopes that the quarterly trimmed mean inflation level could return to the RBA’s band for the first time since 2021. And with it, revive speculation of another 25bpo cut in May. Personally, I continue to believe a July cut as more likely.
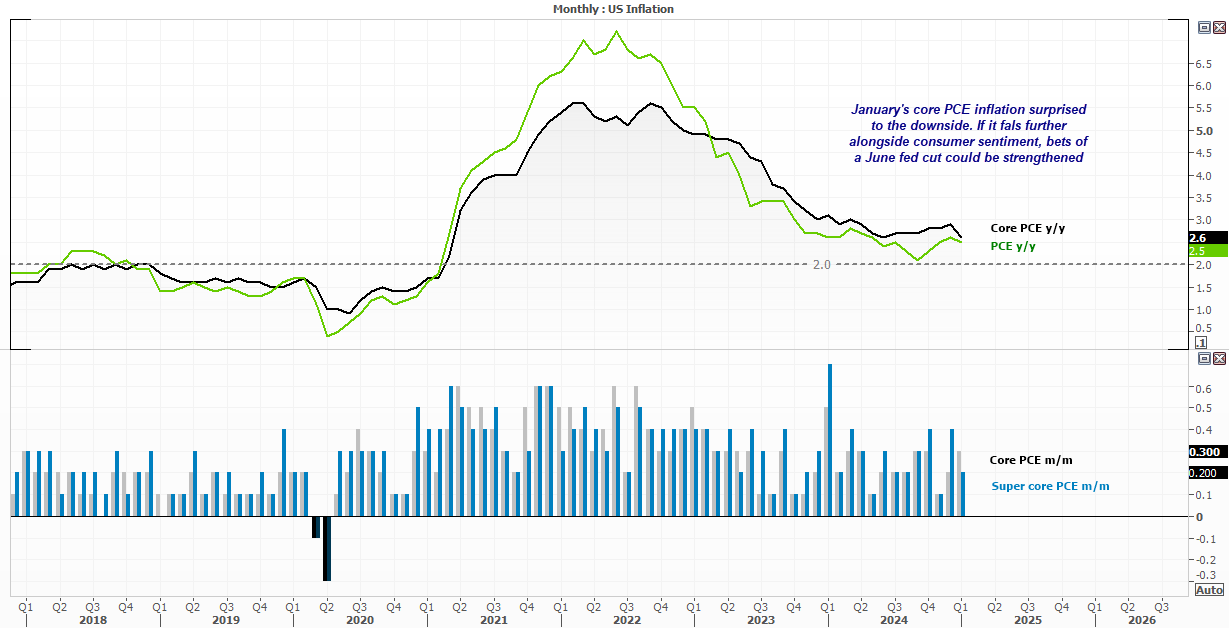
FOMC members are queuing up to speak again, though incoming data will dictate how their words are construed. And unless we see some wild downgrades in the final read of the Q4 GDP report on Wednesday, the core PCE report will be the key focus of the week, with consumer sentiment from the US Consumer Board and University of Michigan potentially providing decent sideshows.
Core PCE was surprisingly soft at 2.6% y/y in January, and bets of a June Fed cut could be bolstered if another soft PCE report is accompanied with more weak consumer sentiment data.
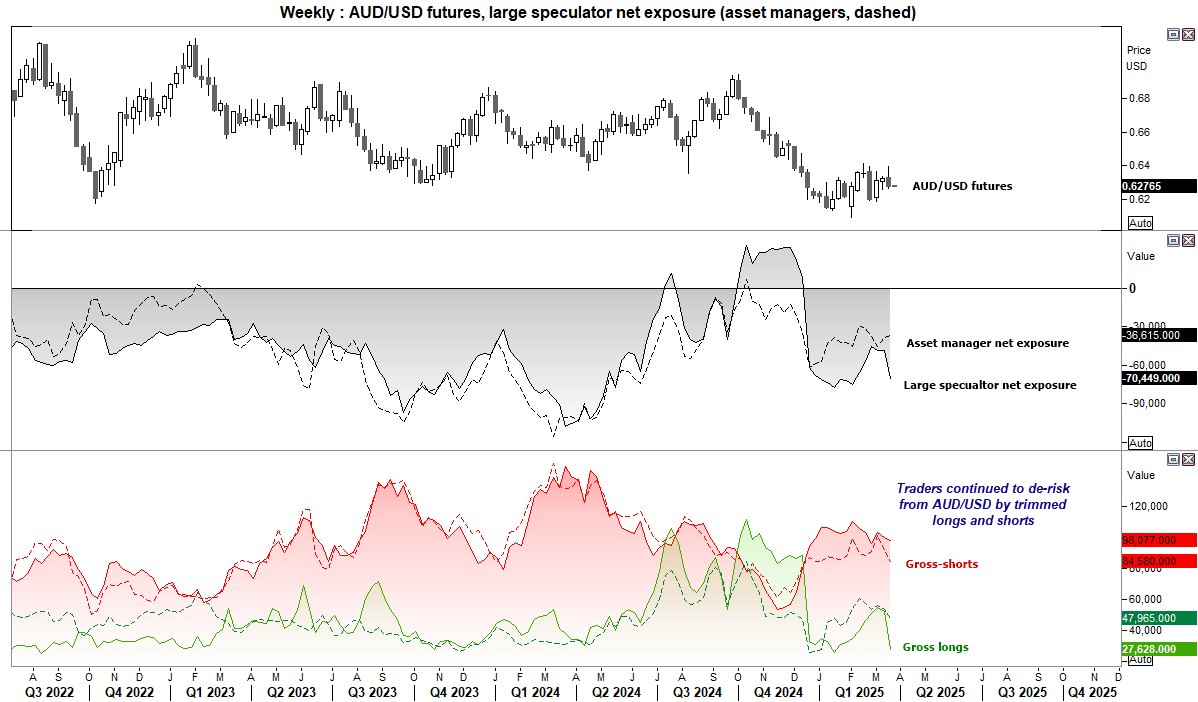
AUD/USD futures – market positioning from the COT report:
Once again, traders de-risked from AUD/USD by trimming both longs and shorts. So while asset managers and large speculators remain net-short AUD/USD, it is not with great bearish conviction. We really need to see a greater divergence of monetary policy expectations between the RBA and Fed for a trend to unfold in either direction. But the potential bear flag on the weekly chart also suggests that risks for AUD/USD are tilted towards the downside, particularly if the Chinese yuan continues to weaken and US dollar strengthen.
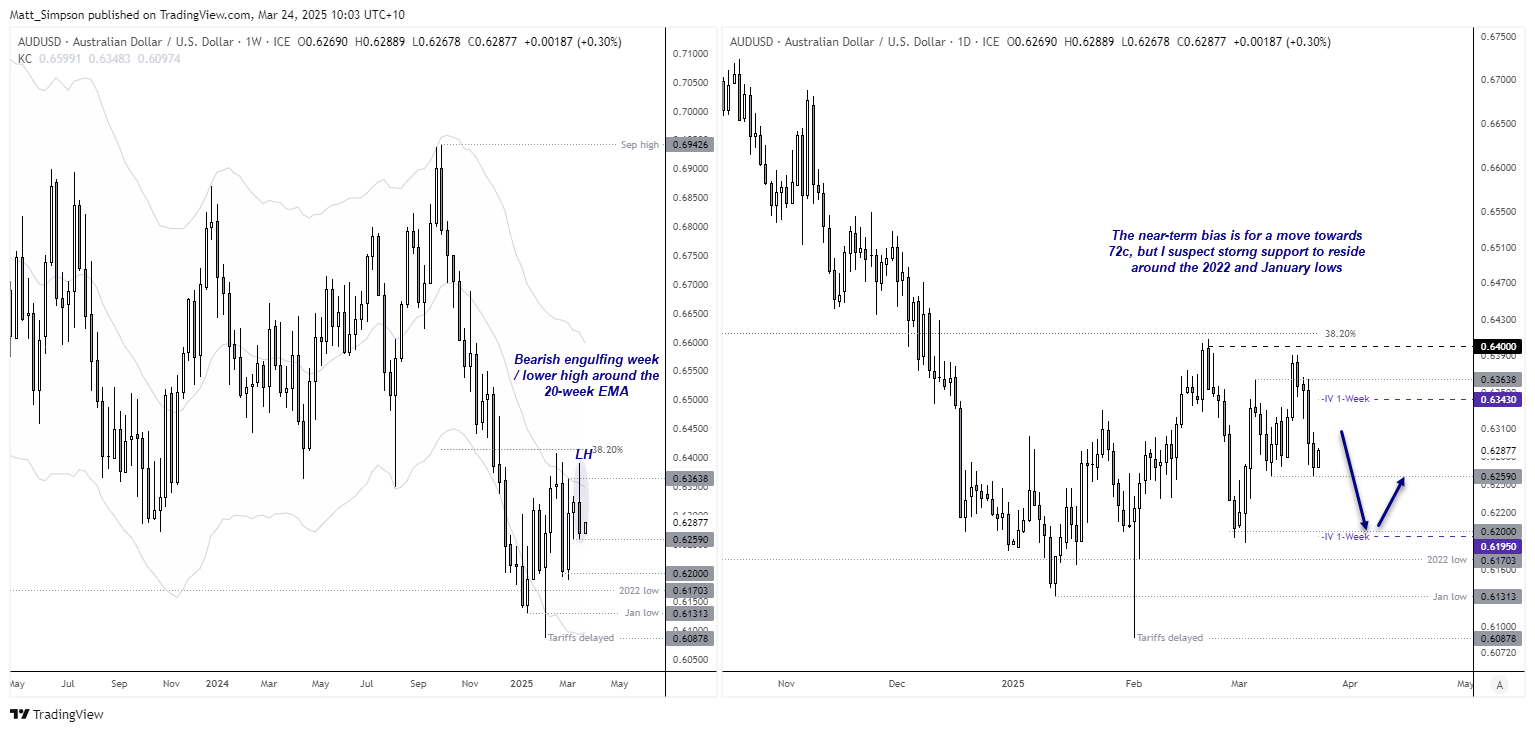
AUD/USD technical analysis
64c remains the level that AUD/USD bulls cannot conquer. Last week’s bearish engulfing candle failed to retest the 64c handle, which makes it a higher low to the false-break of 64c achieved on the week of the 17th of February, which was also a small inverted hammer. The 20-week EMA is also capping as resistance, and with the US dollar index showing signs of bullish life around its cycle lows, perhaps the near-term direction for AUD/USD is indeed lower.
The daily chart shows prices are trying to hold above Friday’s low in early trade on Monday. But given the bearish tones of the weekly, I suspect bears will seek to fade into minor rallies from current support, in anticipation of a break low and move towards 62c.
But I suspect strong support resides around the 2022 low (0.6103) and January low (0.6131) which could also prevent too much of a selloff materialising this week.
-- Written by Matt Simpson
Follow Matt on Twitter @cLeverEdge
Latest market news
September 18, 2025 02:48 PM
June 23, 2025 01:22 PM
June 23, 2025 10:39 AM
June 20, 2025 05:23 PM
June 20, 2025 04:46 PM
June 20, 2025 03:35 PM

June 9, 2025 09:32 AM

May 12, 2025 06:44 AM
April 27, 2025 02:00 PM