
View related analysis:
- AUD/USD Weekly Outlook: GDP, NFP On Tap
- USD, EUR, GBP, JPY Outlook: Weekly COT Report Highlights
- EUR/USD, USD/JPY, USD/CAD Outlook: US Dollar Slammed Ahead of PCE Inflation
- Gold at Technical Crossroads Ahead of GDP, PCE; ASX 200 Stalls at Resistance
The US dollar (USD) continued its descent below 100 on Monday as cracks widened in the US economy and Donald Trump tightened the screws on trade partners. Trump has given until Wednesday, June 4 for all partners to present their best trade deals, or have tariffs reinstated. Last week an appeals court reversed an earlier court ruling to deem the tariffs as illegal.
ISM manufacturing contracted for a third month and at its fastest pace since November (48.5).
- New orders contracted for a fourth moth, though at a slower pace of 76.6 (47.2 prior).
- Employment contracted for a fourth month (46.8).
- Prices paid slowed slightly, but remains elevated and near a 3-year high at 69.4.

US Dollar Index (USD) Technical Analysis
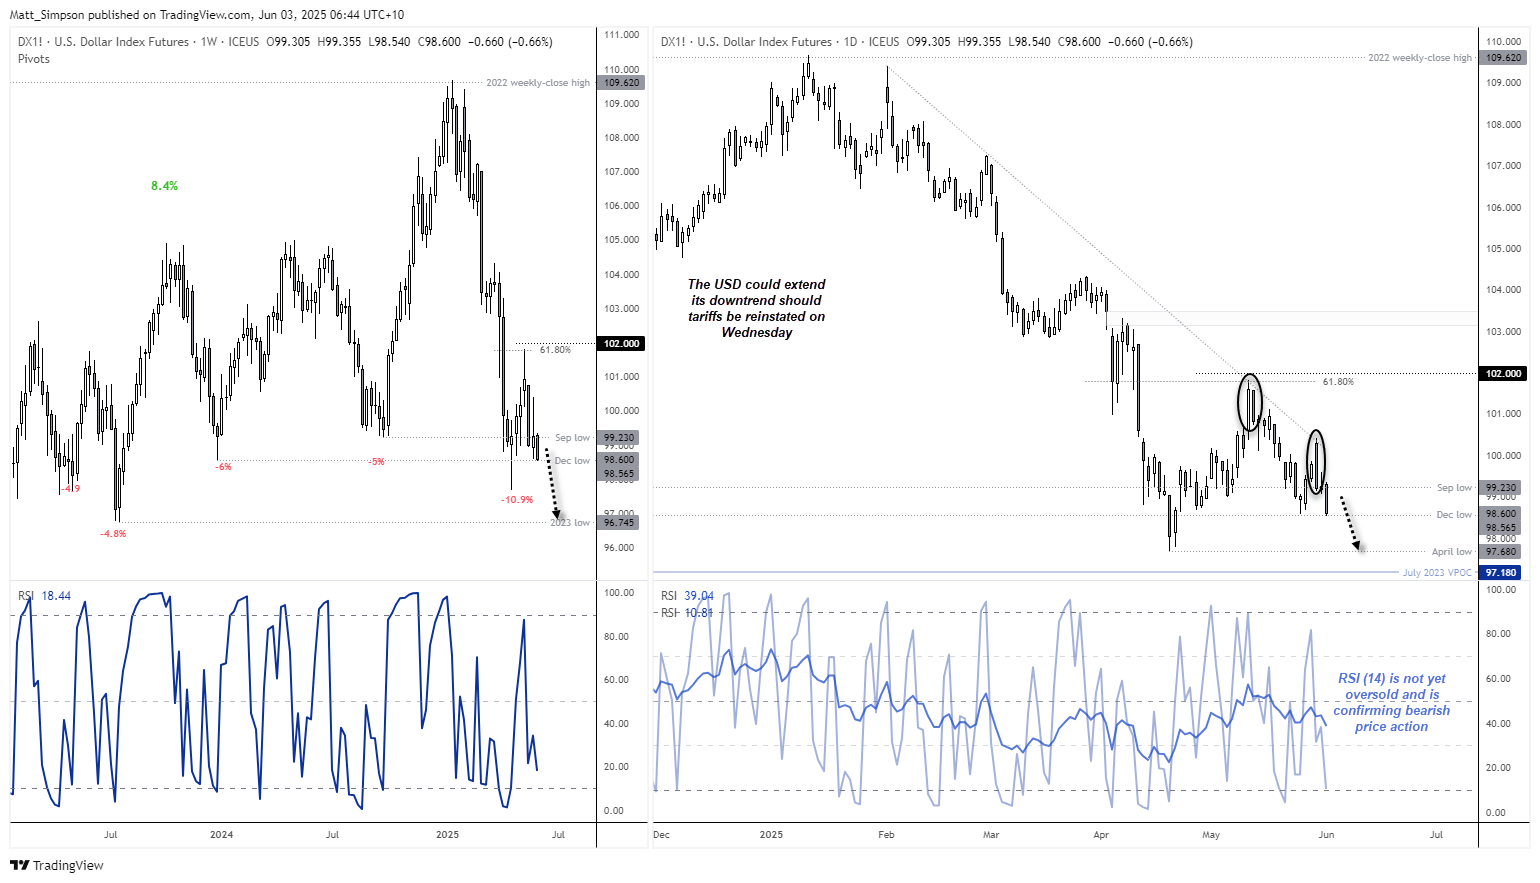
Thursday’s high met resistance almost perfectly at the February bearish trendline. Prices reversed lower and back beneath 100 to close the day with a bearish engulfing candle. The USD Dollar Index is how clinging into the December low (98.59) while the daily chart displays something reminiscent of a head and shoulders top.
While the daily RSI (2) is near its oversold level to warn of mean reversion over the near term, the daily RSI (14) – which represents a higher-timeframe momentum – is not. The RSI (14) is below 50 to show negative momentum and confirming the bearish move. From a purely technical perspective, bears may opt to fade into minor rallies. And the USD seems poised to move lower if tariffs are indeed reinstated on Wednesday.
The 98 handle and April low (97.68) come into focus for bearish if the USD breaks beneath the December low. The next support zone for bears is the 2023 low (97.75) to 97 handle.

NZD/USD Technical Analysis: New Zealand Dollar vs US Dollar
The Reserve Bank of New Zealand (RBNZ) planted the seed that they may be at or near the end of their easing cycle last week, when they cut rates by 25bp to 3.25%. This provides NZD/USD bulls with an edge during bouts of USD weakness and helps explain why NZD/USD was the strongest FX major on Monday.
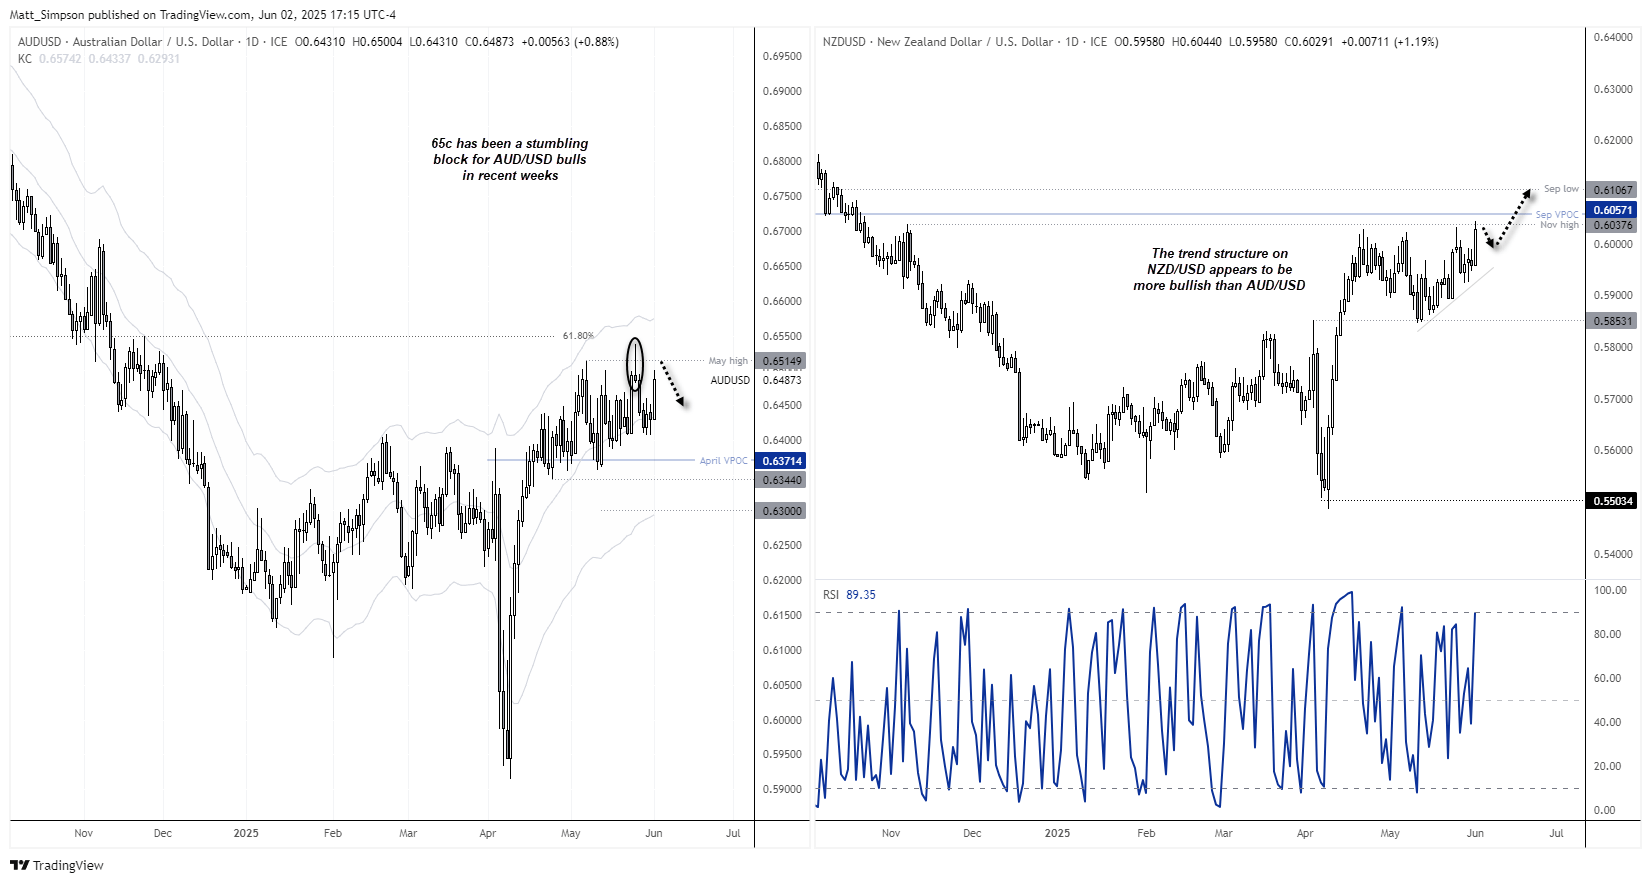
The trend structure on the NZD/USD daily chart appears to be more bullish than AUD/USD. NZD/USD also came close to breaking above its November high on Monday, and price action has generally been much less choppy compared to AUD/USD over the past two weeks. NZD/USD is therefore my preferred bullish setup, though AUD/USD shows the potential for mean reversion and to remain range bound. The relative difference therefor suggests AUD/NZD could move lower.
AUD/USD Technical Analysis: Australian Dollar vs US Dollar
The Australian dollar rose 1% on Monday thanks to the weaker US dollar, and that has taken AUD/USD back up to the top of its 0.64–0.65 range. It is worth noting that 65c has proven a stumbling block for AUD/USD bulls in recent times, so it is an area traders should watch closely to see how prices react. Clearly, if the USD really does roll out of bed then a bullish breakout seems more likely on AUD/USD than not. Though there seems to be a reasonable chance that any initial move towards last week’s high could get faded and provide a cheeky short over the near term.

USD/CAD Technical Analysis: US Dollar vs Canadian Dollar
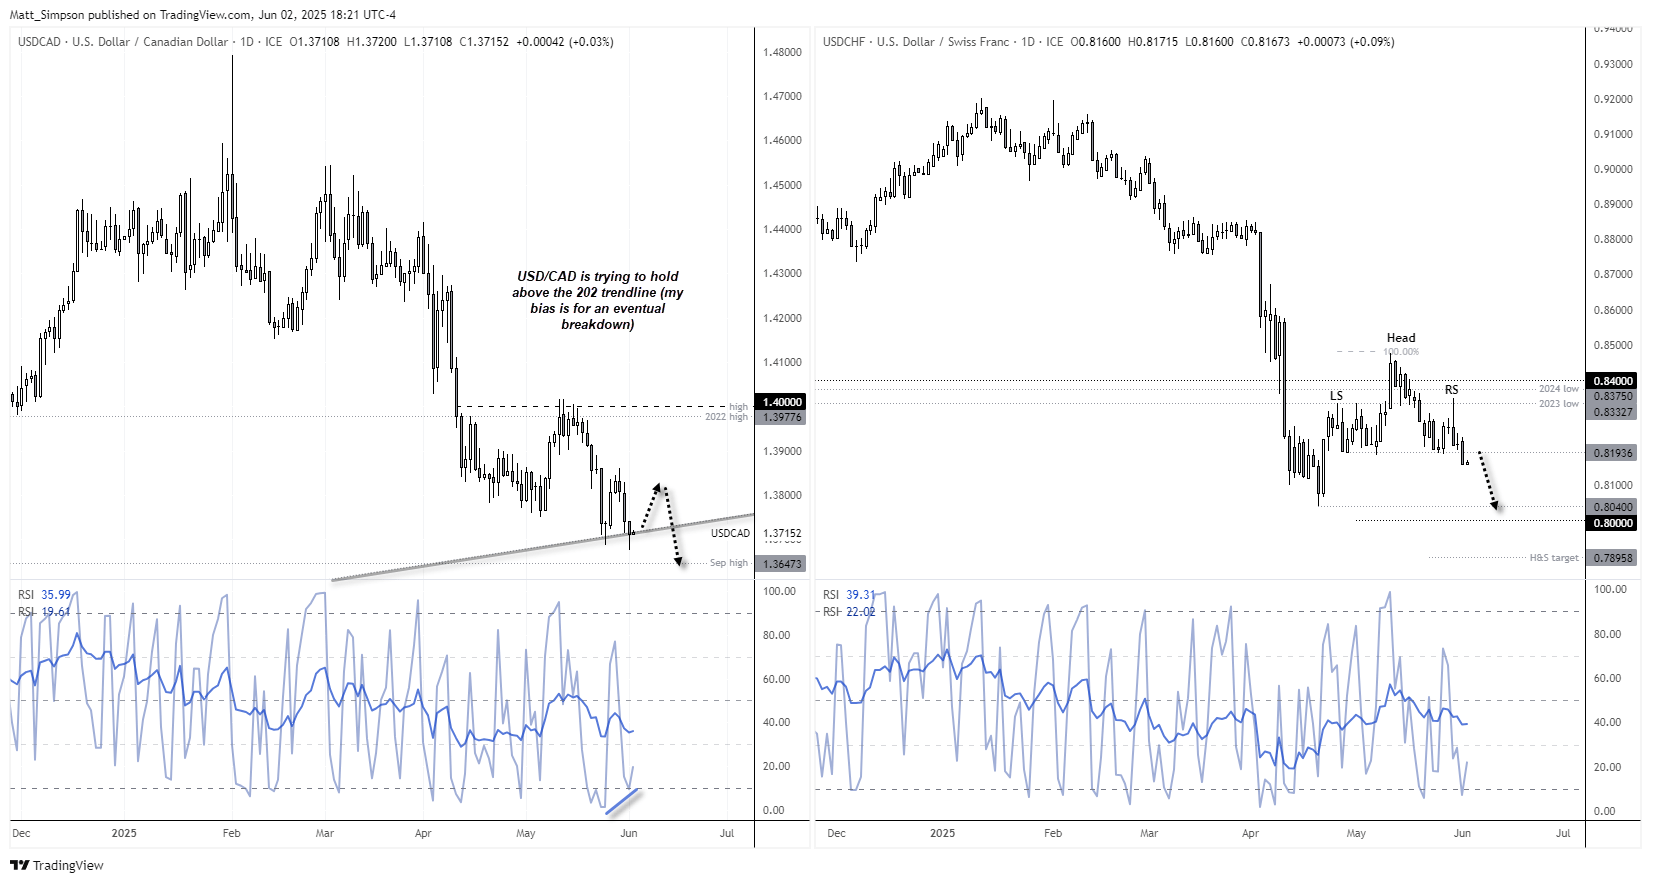
I outlined a bullish case for the Canadian dollar last week based on market positioning, which assumes an eventual break of a bearish trendline. If correct, that translates to a bearish breakout on USD/CAD beneath its 2021 bullish trendline.
We have now seen USD/CAD twice try to break the trendline in question. While the purist could deem it as invalidated, the trendline clearly remains relevant, given that prices closed almost perfectly on it on Monday following an intraday break beneath it. We could also label the two swing lows as a double bottom, and USD/CAD could indeed rally if tariffs are not reinstated with Canada tomorrow. So, like AUD/USD, the Canadian dollar is at a crucial juncture which really could see the market break either way depending on how Trump plays it over the next 48 hours.
USD/CHF Technical Analysis: US Dollar vs Swiss Franc
A head and shoulders top has formed on the USD/CHF daily chart. The bearish continuation pattern (during a downtrend) projects a downside target around 0.7895, though the April low (0.8040) and 0.80 handle are likely to provide support if prices continue lower from here.
USD/CHF is the ideal instrument for traders seeking a direct correlation to the US dollar index, though price action is cleaner in the Swiss franc that it is on the USD index.
Economic Events in Focus (AEST / GMT+10)
08:45: NZD Terms of Trade Index (Q1) (NZD/USD, AUD/NZD, NZD/JPY)
09:50: JPY Monetary Base (May) (USD/JPY, EUR/JPY, Nikkei 225)
11:30: AUD RBA Meeting Minutes Current Account (Q1), Company Profits (Q1), Business Inventories, Net Exports Contribution (AUD/USD, ASX 200, AUD/JPY, AUD/NZD)
11:45: CNY Caixin Manufacturing PMI (May) (USD/CNY, CNH/JPY)
13:35: JPY 10-Year JGB Auction (USD/JPY, Nikkei 225)
16:30: CHF CPI (May) (USD/CHF, CHF/JPY, EUR/CHF)
00:00: USD JOLTS Job Openings (Apr), Factory Orders (Apr), Durables Goods Orders (Apr) (USD, Gold, WTI Crude Oil, S&P 500, Nasdaq 100, Dow Jones)
00:10: USD IBD/TIPP Economic Optimism (Jun) (USD, Gold, WTI Crude Oil)
02:45: USD Fed Goolsbee Speaks (USD, Gold, WTI Crude Oil)
03:00: USD Fed Governor Cook Speaks (USD, Gold, WTI Crude Oil)
05:30: USD Fed Logan Speaks (USD, Gold, WTI Crude Oil)
View the full economic calendar
-- Written by Matt Simpson
Follow Matt on Twitter @cLeverEdge
Latest market news
September 18, 2025 02:48 PM
June 23, 2025 01:22 PM
June 23, 2025 10:39 AM
June 20, 2025 05:23 PM
June 20, 2025 04:46 PM
June 20, 2025 03:35 PM

February 10, 2025 08:45 PM

February 1, 2025 02:00 AM

January 1, 2025 07:30 AM

December 23, 2024 02:45 PM