

Australian Technical Forecast: AUD/USD Weekly Trade Levels
- AUD/USD rebound off technical support covers 2025 range in three-week advance
- Aussie testing September downtrend- outlook constructive while above 2024 low
- Resistance 6408/29, 6502/50 (key), 6671- Support 6290, 6179-6200 (key), 6007/45
The Australian Dollar is attempting to mark a third-consecutive weekly advance with AUD/USD trading into technical resistance at the September downtrend. While the reversal does keep the medium-term focus higher, the immediate advance may be vulnerable here. Battle lines drawn on the AUD/USD weekly technical chart into the close of the month.
Review my latest Weekly Strategy Webinar for an in-depth breakdown of this Aussie setup and more. Join live on Monday’s at 8:30am EST.Australian Dollar Price Chart – AUD/USD Weekly
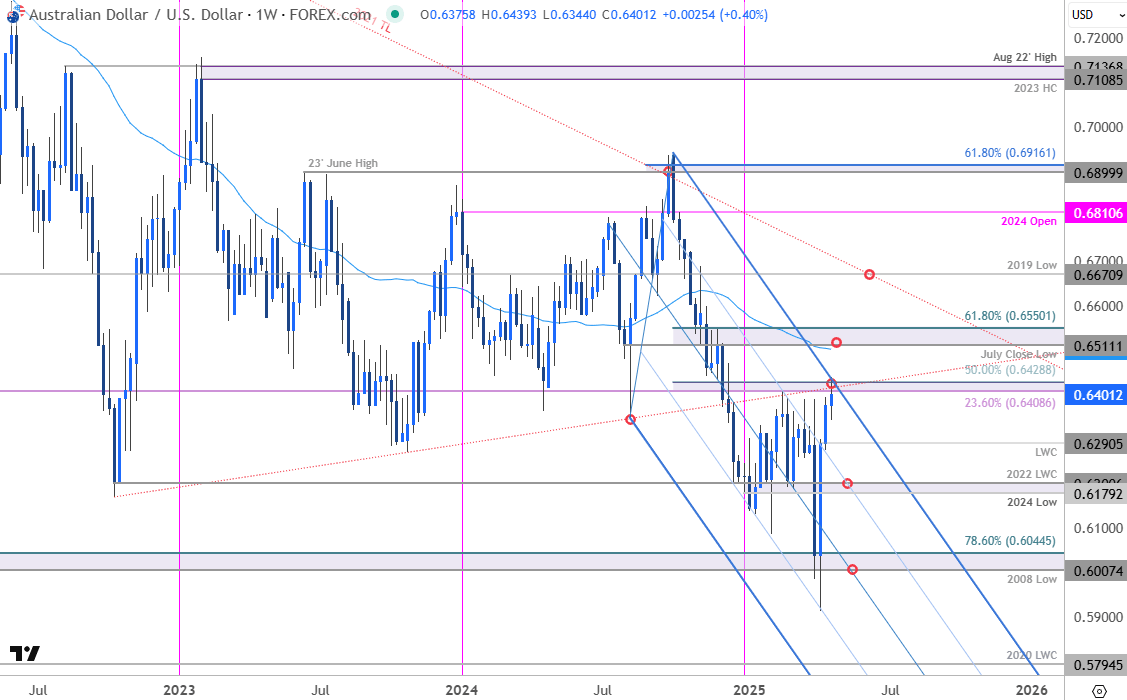
Chart Prepared by Michael Boutros, Sr. Technical Strategist; AUD/USD on TradingView
Technical Outlook: The Australian Dollar rebounded off technical support at multi-year lows this month at 6007/45- a region defined by the 2008 swing low and the 78.6% retracement of the 2020 advance. The subsequent rally has now extended nearly 8.9% off the yearly low with AUD/USD trading just below confluent resistance at 6408/29- looking for a reaction off this mark in the weeks ahead with the near-term advance vulnerable while below.
Initial weekly support rests with the yearly low-week reversal close (LWC) at 6290 and is backed by the 2024 low / 2022 LWC at 6179-6200. Losses below this threshold would threaten downtrend resumption back towards key support at the 60-handle. Subsequent support seen at the 2020 LWC at 5795.
A topside breach / close above this pivot zone exposes key resistance at 6502/50- a region defined by the 52-week moving average, the Julye close low, and the 61.8% retracement of the 2024 decline. Look for a larger reaction there IF reached- ultimately a close above the 2019 low at 6671 would be needed to suggest a more significant breakout is underway.

Bottom line: The Australian Dollar has rallied into confluent resistance at the September downtrend- risk for possible topside exhaustion / price inflection into this threshold. From a trading standpoint, a good zone to reduce long-exposure / raise protective stops- losses should be limited to 6179 IF price is heading higher on this stretch with a close above 6429 needed to suggest a more significant low is in place.
Keep in mind we get the release of key U.S. inflation data (Core PCE) and Non-Farm Payrolls next week into the monthly cross. Stay nimble into the releases and watch the weekly closes here for guidance. I’ll publish an updated Australian Dollar Short-term Outlook once we have further clarity on the near-term AUD/USD technical trade levels.
Australia / US Economic Calendar
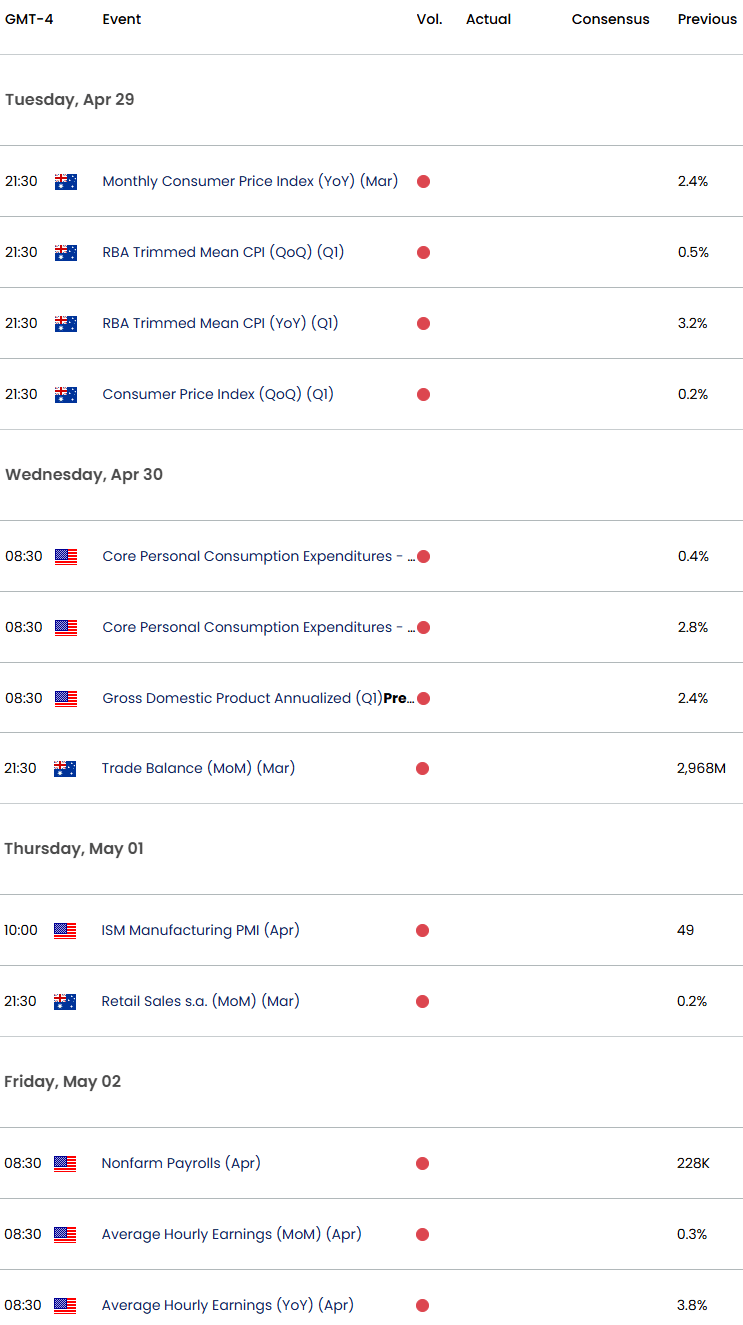
Economic Calendar - latest economic developments and upcoming event risk.
Active Weekly Technical Charts
- British Pound (GBP/USD)
- Canadian Dollar (USD/CAD)
- Euro (EUR/USD)
- US Dollar Index (DXY)
- Japanese Yen (USD/JPY)
- Gold (XAU/USD)
- S&P 500, Nasdaq, Dow
- Crude Oil (WTI)
--- Written by Michael Boutros, Sr Technical Strategist with FOREX.com
Follow Michael on X @MBForex
Latest market news
September 18, 2025 02:48 PM
June 23, 2025 01:22 PM
June 23, 2025 10:39 AM
June 20, 2025 05:23 PM
June 20, 2025 04:46 PM
June 20, 2025 03:35 PM

June 18, 2025 07:38 PM

June 18, 2025 03:24 PM
June 16, 2025 03:30 PM

June 12, 2025 04:08 PM