

Australian Technical Forecast: AUD/USD Weekly Trade Levels
- AUD/USD rally halted at resistance of a fifth-consecutive week
- Aussie May opening-range preserved post-RBA rate cut- breakout pending
- Resistance 6429/45 (key), 6485, 6511/50- Support 6286/91 (key), 6144/79, 6007/45
The Australian Dollar is trading just below major resistance with AUD/USD holding a within a contractionary range for the past five weeks. The May opening-range is preserved on the heels today’s RBA rate cut and the focus remains on a breakout for guidance with the April rally still vulnerable while below the yearly moving average. Battle lines drawn on the AUD/USD weekly technical chart.
Review my latest Weekly Strategy Webinar for an in-depth breakdown of this Aussie setup and more. Join live on Monday’s at 8:30am EST.Australian Dollar Price Chart – AUD/USD Weekly
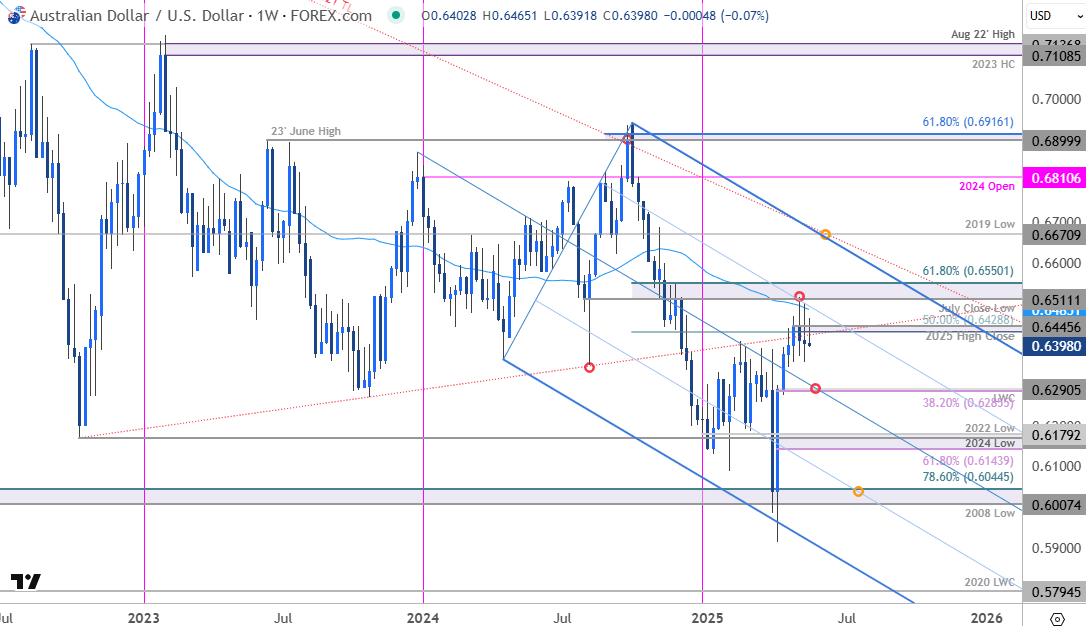
Chart Prepared by Michael Boutros, Sr. Technical Strategist; AUD/USD on TradingView
Technical Outlook: In my last Australian Dollar Forecast we noted that AUD/USD had, “rallied into confluent resistance at the September downtrend- risk for possible topside exhaustion / price inflection into this threshold. From a trading standpoint, a good zone to reduce long-exposure / raise protective stops- losses should be limited to 6179 IF price is heading higher on this stretch with a close above 6429 needed to suggest a more significant low is in place.” Aussie has held below resistance for nearly five-weeks now with multiple breakout attempts failing at the 52-week moving average.
Weekly resistance now stands with the 2025 high-close / 50% retracement of the September decline at 6429/45 and is backed again by the yearly moving average, currently near ~6485. Critical resistance is eyed with the July close low / 61.8% retracement at 6511/50 and a breach / close above this threshold is needed to fuel the next leg of the advance towards the 2019 low at 6671.
Weekly support rests with the 38.2% retracement of the yearly range / 2025 low-week close at 6286/91. Note that the median-line converges on this zone over the next few weeks and a weekly close below would be needed to suggest a more significant high is in place. Subsequent support seen at 6143/79- a region defined by the 61.8% retracement and the 2024/2022 swing lows.

Bottom line: The Australian Dollar rally has been halted at resistance and the focus is on a breakout of this multi-week range just below. From a trading standpoint, losses would need to be limited to 6285 IF price is heading higher on this stretch with a close above the 52-week moving average needed to fuel the next leg of the advance. Review I’ll publish an updated Australian Dollar Short-term Outlook once we have further clarity on the near-term AUD/USD technical trade levels.
Australia / US Economic Calendar
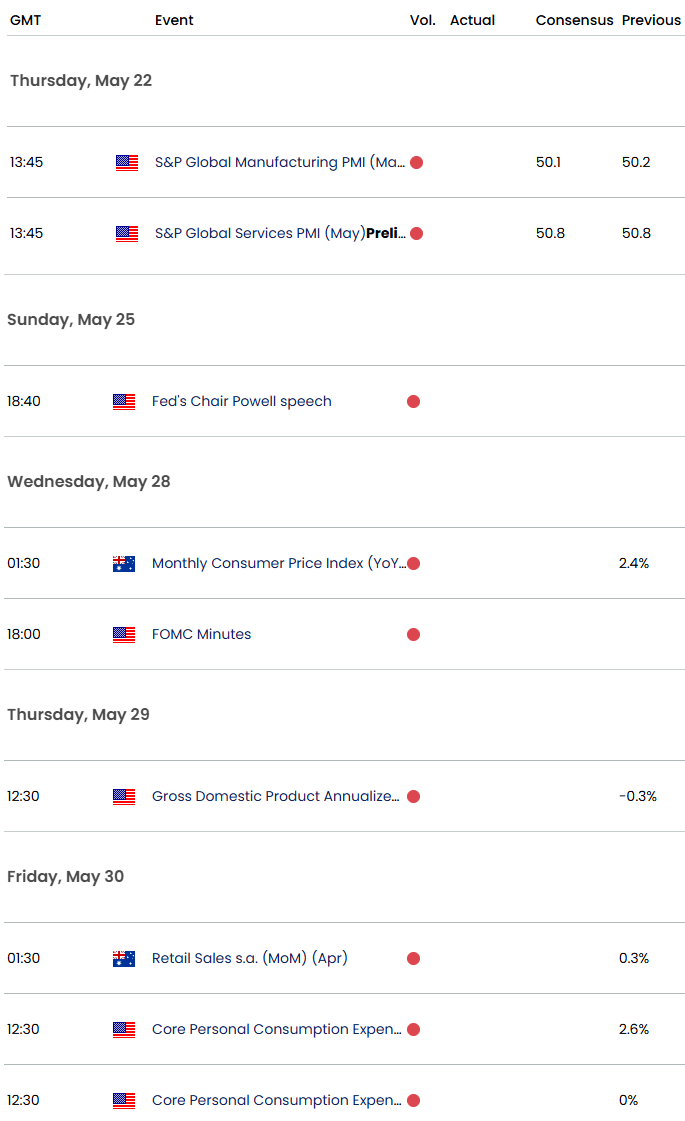
Economic Calendar - latest economic developments and upcoming event risk.
Active Weekly Technical Charts
- British Pound (GBP/USD)
- Japanese Yen (USD/JPY)
- Canadian Dollar (USD/CAD)
- Gold (XAU/USD)
- US Dollar Index (DXY)
- Euro (EUR/USD)
- S&P 500, Nasdaq, Dow
- Swiss Franc (USD/CHF)
- Crude Oil (WTI)
--- Written by Michael Boutros, Sr Technical Strategist with FOREX.com
Follow Michael on X @MBForex
Latest market news
September 18, 2025 02:48 PM
June 23, 2025 01:22 PM
June 23, 2025 10:39 AM
June 20, 2025 05:23 PM
June 20, 2025 04:46 PM
June 20, 2025 03:35 PM

June 19, 2025 11:09 PM

June 18, 2025 09:32 PM

June 17, 2025 10:59 PM
June 16, 2025 10:27 PM