

Over the past two trading sessions, Bitcoin has gained more than 6%, climbing back to the $90,000 per BTC zone, a level not seen since early March. This renewed bullish momentum has been driven in part by improving sentiment in the crypto market, fueled by the continued weakness of the U.S. dollar. For now, it appears that investors are choosing to hold BTC as a temporary safe haven amid ongoing global economic uncertainty.

Has Bitcoin Become a Safe Haven?
Bitcoin, the world’s leading cryptocurrency, has risen more than 20% from its low on April 7. This strong upward move is directly linked to growing investor distrust of the U.S. dollar, which has been weighed down by the escalating trade war and political uncertainty in the U.S. These factors have triggered a massive capital outflow, resulting in significant short-term dollar weakness.
That weakness is clearly reflected in the DXY Index, which measures the dollar against a basket of other currencies. It has dropped to 98 points, the lowest level since 2022. Historically, Bitcoin has performed well during periods of dollar weakness, and this time appears to be no different.
This new BTC momentum is also visible in the activity of the official Bitcoin ETF, which recorded over $380 million in inflows at the start of the week—further validating growing institutional interest in the current environment.
Currently, BTC is being considered a short-term safe haven, showing technical behavior similar to gold. In fact, over the last 10 sessions, BTC has mirrored Gold’s upward movements, and the correlation between the two assets has reached a positive 77%. While this correlation could shift over time, it shows that—for now—Bitcoin is acting as an alternative store of value as the U.S. dollar continues to weaken.
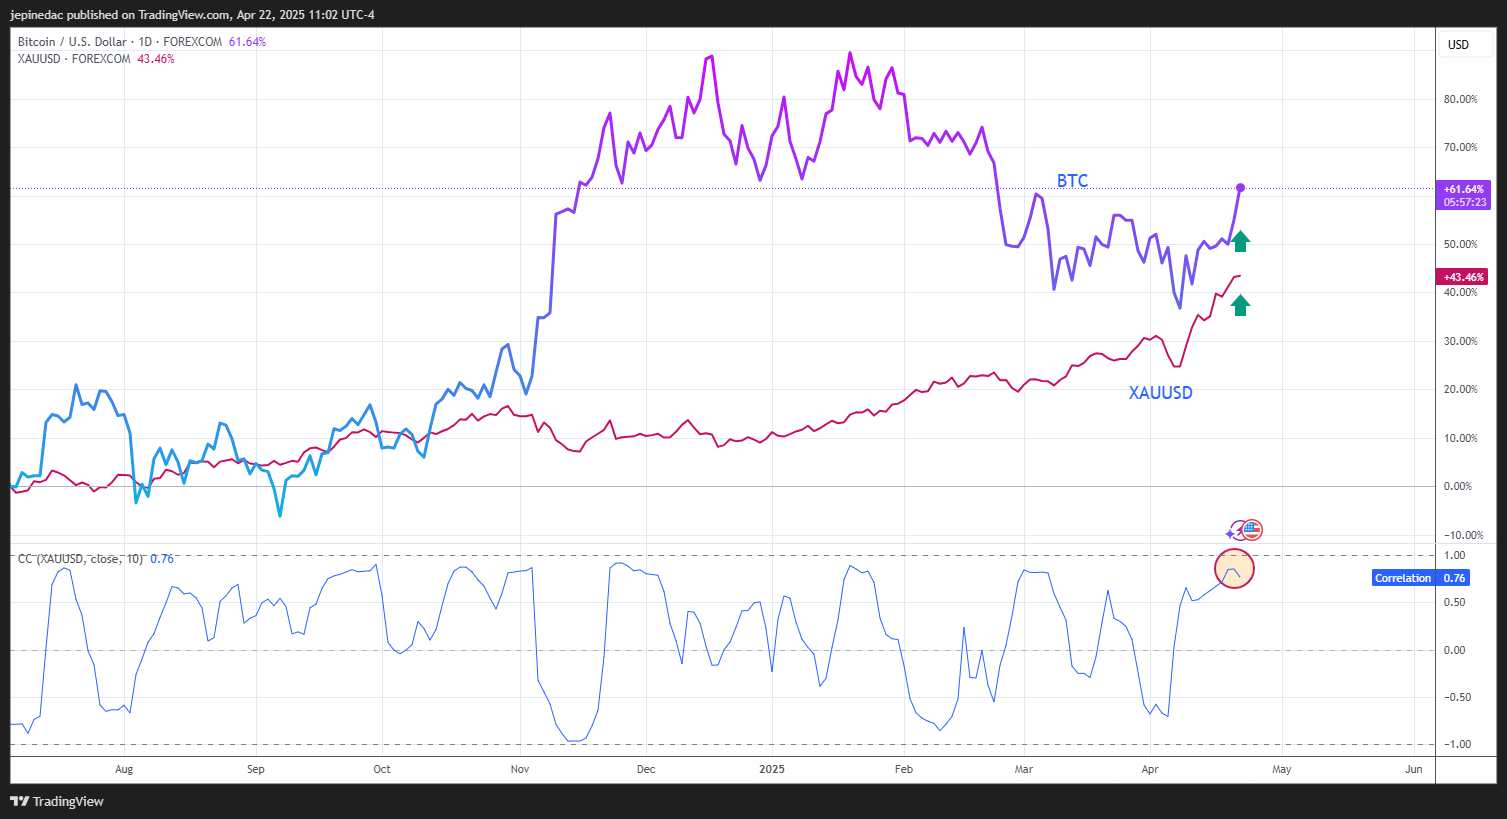
Source: StoneX, Tradingview
If the U.S. dollar’s weakness persists, this correlation between BTC and gold could strengthen further, adding additional buying pressure to Bitcoin in the near term. However, it’s important to note that BTC remains highly sensitive to changes in risk appetite, and this strength could fade quickly if market sentiment shifts. For now, the current rally appears to be a short-term reaction to dollar-related uncertainty.
How Is Confidence in the Crypto Market?
Currently, the CoinMarketCap Fear & Greed Index for cryptocurrencies stands at 38, right on the boundary between the “fear” and “neutral” zones.
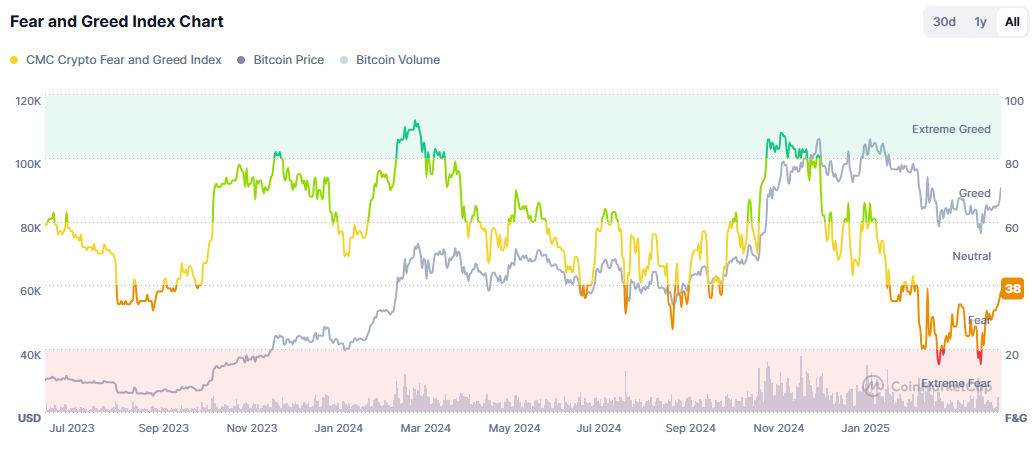
Source: Coinmarketcap
Earlier in April, the index dropped below 20 points, signaling a phase of extreme fear. Since then, however, it has shown a steady recovery, pointing to improving sentiment in the crypto market. If the index climbs back above 40, it could be a key signal to sustain bullish momentum in Bitcoin over the next few sessions.
Bitcoin Technical Outlook
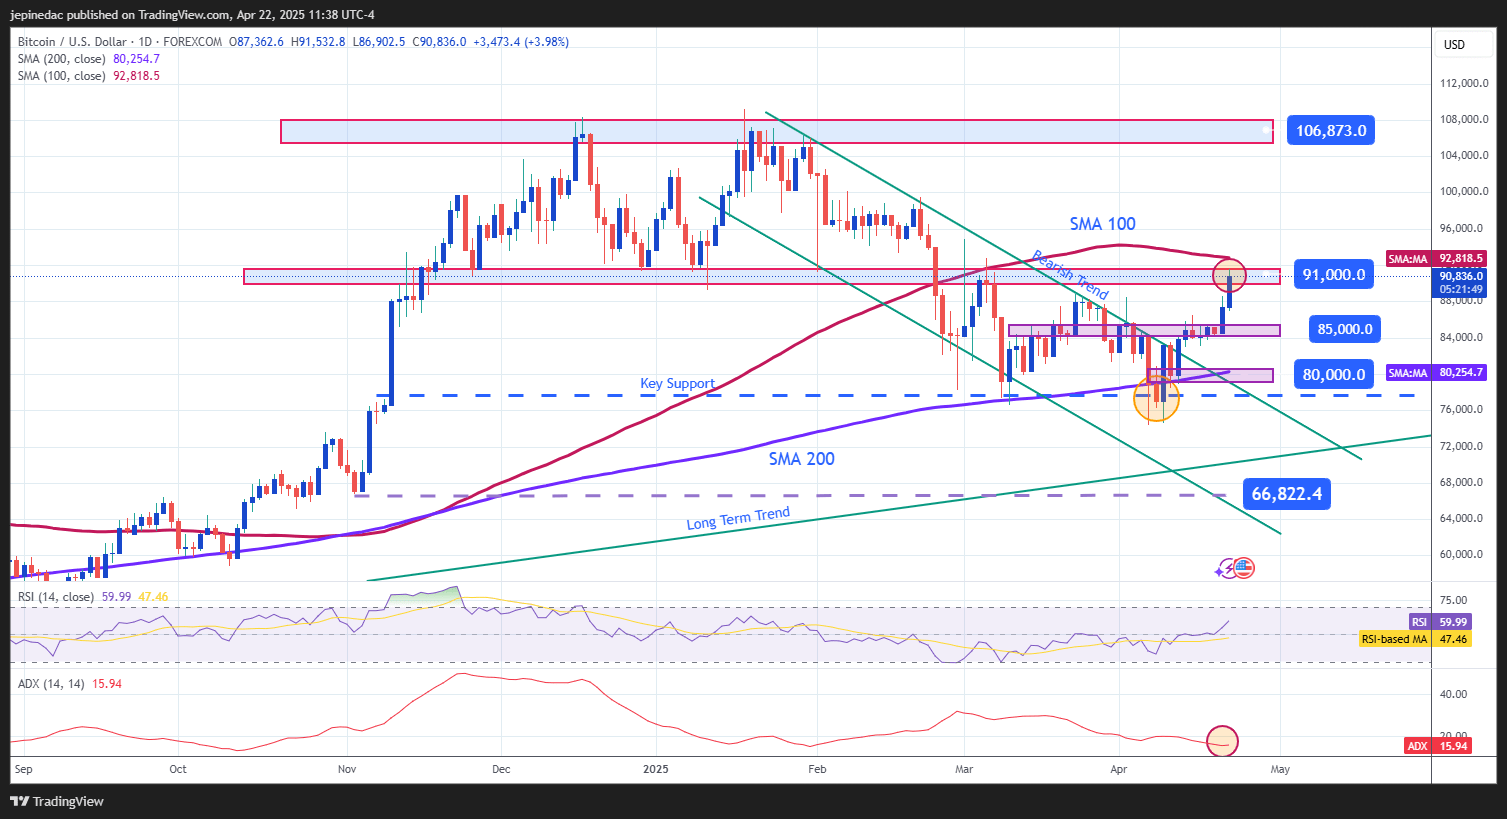
Source: StoneX, Tradingview
- Breakout From Bearish Channel: Since April 14, BTC has posted steady gains, strong enough to break out of the bearish channel that had held since early 2025. This breakout has triggered a fresh bullish rally, now approaching key resistance zones. If BTC successfully breaches those levels, a stronger uptrend could take hold in the coming weeks.
- ADX: The ADX line remains below the 20 mark, suggesting low volatility and indicating that the current bullish move has not yet formed into a strong trend. This may be due to BTC testing resistance levels around $90,000. If ADX fails to rise soon, the rally could lose momentum and enter a pause phase.
- RSI: The RSI remains above the 50 level, signaling that buying pressure still dominates in the short term. However, the indicator is nearing the overbought zone (70), and if that threshold is reached, a technical correction could emerge due to temporary market imbalance.
Key Levels:
- $91,000 – Primary Resistance: A recent consolidation level that aligns with the 100-period simple moving average. Sustained trading above this level could lead to a stronger bullish continuation in the sessions ahead.
- $85,000 – Near-Term Support: A recent neutral zone that may act as support on pullbacks. A return to this level could signal a potential sideways consolidation phase.
- $80,000 – Key Support: A critical technical level not seen since November 2024, aligned with the 200-period moving average. A move back to this zone could reactivate the previous bearish trend.
Written by Julian Pineda, CFA – Market Analyst
Latest market news
September 18, 2025 02:48 PM
June 23, 2025 01:22 PM
June 23, 2025 10:39 AM
June 20, 2025 05:23 PM
June 20, 2025 04:46 PM
June 20, 2025 03:35 PM

May 28, 2025 03:30 PM

May 16, 2025 08:50 AM

April 17, 2025 11:48 AM

March 27, 2025 04:35 PM