

The recent bullish rebound in Bitcoin (BTC) since March 11 has so far been insufficient to reach the $90,000 per coin mark. A persistent bearish ceiling has kept pressure on the cryptocurrency, as global economic uncertainty continues to weigh on risk appetite in recent trading sessions.

Is Market Confidence at Risk?
It’s important to note that Bitcoin has been caught in the wave of uncertainty stemming from the potential implementation of a 25% tariff by the U.S. government on imports from several countries, as announced by the White House.
For now, the trade war appears far from over. Former President Donald Trump has hinted at targeting additional countries beyond Mexico and Canada, although no official date has been confirmed. The April 2 deadline remains unofficial at this stage.
This climate of economic tension has directly impacted demand for risk assets, including cryptocurrencies. In this context, ongoing international conflicts are shaping investor behavior and influencing key Bitcoin metrics.
One such metric is the Long/Short Ratio, published by Coinglass, which tracks open long and short positions across major crypto exchanges. Currently, it stands at a highly neutral level of 1.00, indicating an ongoing balance between buying and selling positions. This equilibrium highlights the lack of a clear directional bias in the short term. Over the past month, the ratio has hovered in neutral territory, signaling cautious behavior among market participants.
Chart: Long/Short Ratio – Coinglass
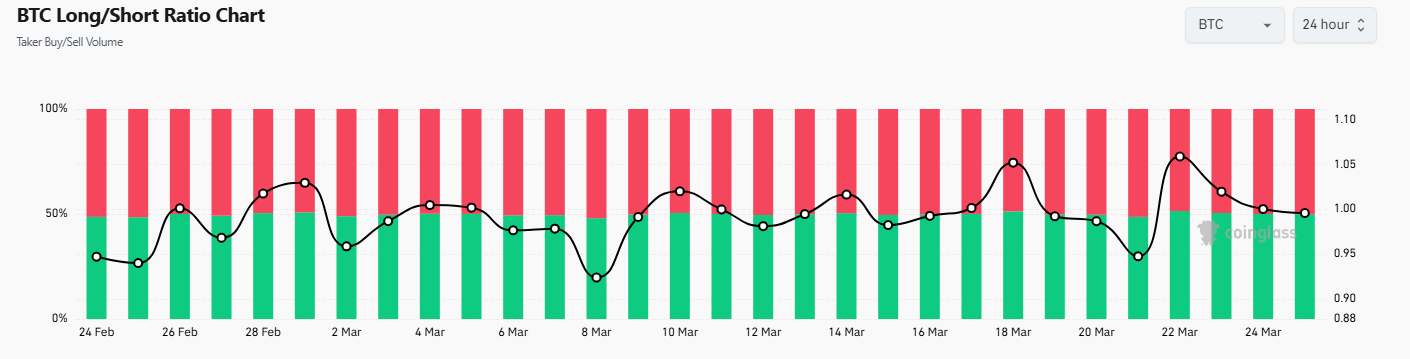
Source: Coinglass
A second important indicator is the Crypto Fear & Greed Index, which currently sits at 34, placing it firmly in the “fear” zone. This level reflects a persistent lack of market confidence, as the index has remained in fear territory since last month. Readings below 40 suggest that traders are reluctant to accumulate long positions.
CMC Crypto Fear and Greed Index
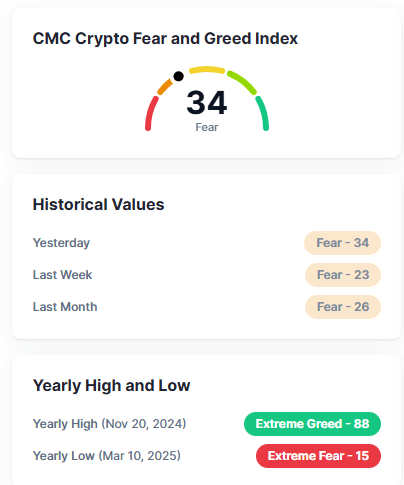
Source: Coinmarketcap
Together, these two indicators confirm a climate of hesitation among crypto investors. The lingering economic fears related to the trade war have prevented a solid bullish trend from taking hold in the broader Bitcoin outlook.
If both the Fear & Greed Index and the Long/Short Ratio continue to reflect indecision, markets may remain wary of reentering risk assets in the midst of a major trade conflict. This could reinforce bearish pressure in the BTC market unless positive developments emerge regarding the trade measures initiated by the White House over a month ago.
Technical Outlook for Bitcoin
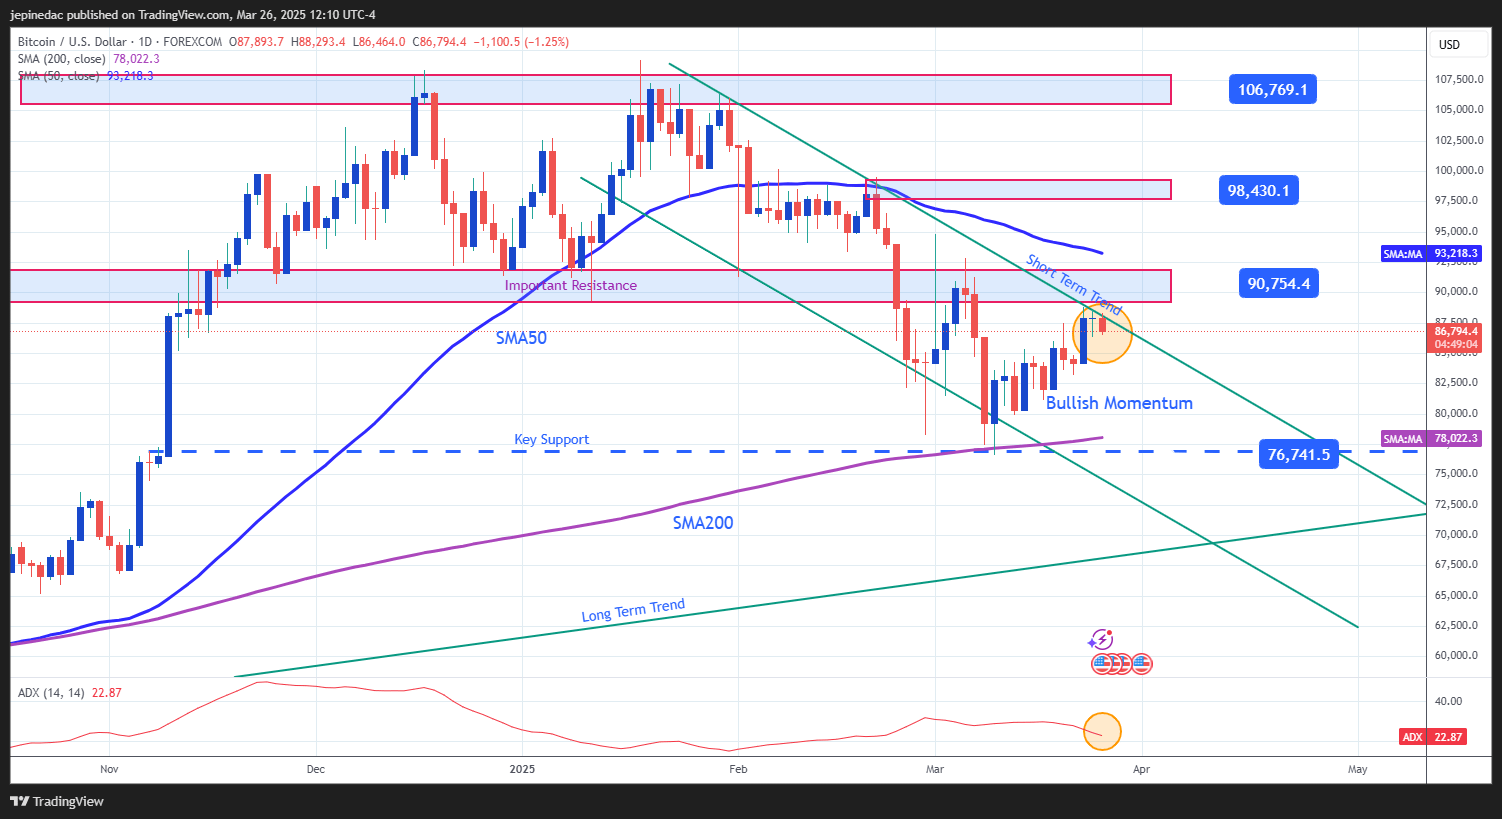
Source: StoneX, Tradingview
- Bearish Channel: Since January 20, BTC has been trading within a descending channel, which drove the price down to $76,600. Currently, the price is testing the upper boundary of this channel, but the last two candles have lacked sufficient bullish momentum to break through. As such, the channel formation remains a key technical feature, favoring selling pressure in the upcoming trading sessions.
- ADX: The Average Directional Index (ADX) is now approaching the neutral level of 20, maintaining a steady downward slope. This suggests that the past 14 sessions have shown weak trend direction, just as price approaches the $90,000 area again. As long as the ADX hovers around the 20 mark, the buying momentum may continue to fade, making it harder to break the current bearish structure.
Key Levels to Watch:
- 90k – Main Resistance: This level, which previously acted as strong support, is now a key resistance zone. A breakout above $90,000 could reignite bullish interest and open the door for a more sustained recovery, posing a serious threat to the bearish channel currently in place.
- 98k – Distant Resistance: This was one of the peak levels reached in February, located in an area of heavy price consolidation. Price action near this zone could revive the neutral momentum observed during that time.
- 76k – Key Support: This level aligns with the 200-period simple moving average and serves as a critical reference point to evaluate the continuation of the bearish bias. A breakdown below this threshold could lead to further downside acceleration for BTC in the short term.
Written by Julian Pineda, CFA – Market Analyst
Latest market news
September 18, 2025 02:48 PM
June 23, 2025 01:22 PM
June 23, 2025 10:39 AM
June 20, 2025 05:23 PM
June 20, 2025 04:46 PM
June 20, 2025 03:35 PM

May 28, 2025 03:30 PM

May 16, 2025 08:50 AM

April 17, 2025 11:48 AM

March 27, 2025 04:35 PM