

Today, Bitcoin has recorded a drop of more than 10%, breaking below the key psychological level of $80,000 per BTC. The selling pressure, which began over the weekend, has been mainly driven by the rising perception of market risk, as the conflict stemming from the new trade war continues to escalate. In this context, investors appear to be moving away from risk assets, such as Bitcoin.

The New Trade War
Shortly after President Donald Trump presented a chart outlining tariffs to be imposed on dozens of countries—establishing a minimum 10% tariff on all imports into the U.S.—markets reacted negatively, viewing this as a bad sign for global economic growth.
In response, China quickly announced retaliatory tariffs of 34% on all imports from the United States, aiming to protect its economy from what it considers arbitrary measures by the White House.
Tensions escalated further when Trump threatened to impose additional 50% tariffs if China does not withdraw its countermeasures. These new tariffs could take effect as early as April 9 if no resolution is reached by tomorrow.
This ongoing trade conflict is particularly significant for the technology sector, as trade between the two nations is vital for the production of advanced chips and batteries. Potential tariffs on these goods could severely impact the cryptocurrency mining industry, reducing profitability and putting the digital asset ecosystem at risk in the short term.
Furthermore, the rising tension between the world’s two largest economies has generated a global sense of risk, which is clouding growth outlooks. In this environment, Bitcoin continues to be viewed as a high-risk asset, leading many investors to seek refuge in more stable instruments such as U.S. Treasuries. If the trade war intensifies, Bitcoin may face additional headwinds due to increased mining costs and a decline in risk appetite, further strengthening the downward pressure that has dominated recent trading sessions.
How Is Confidence Holding in the Crypto Market?
Currently, the CoinMarketCap Fear & Greed Index for cryptocurrencies stands at 17, right on the edge between the “fear” and “extreme fear” zones.
Chart: CMC Crypto Fear and Greed Index Behavior
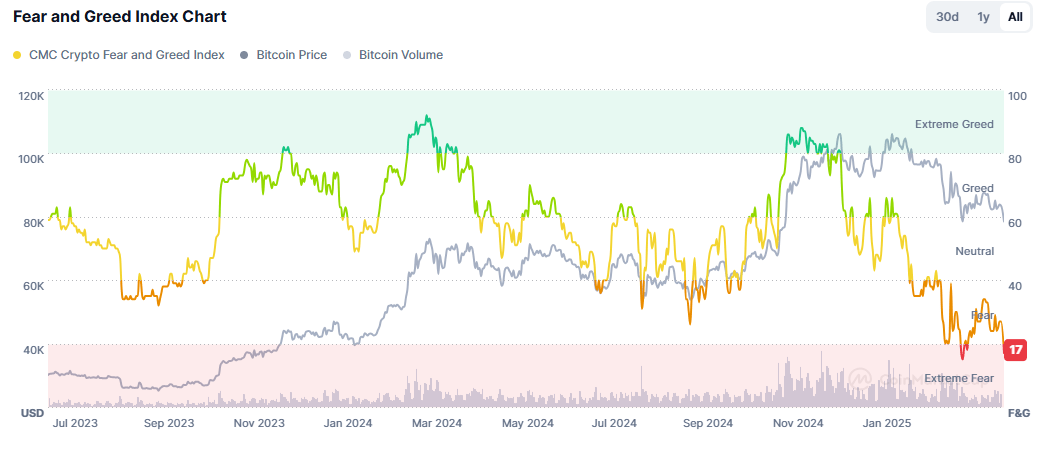
Source: Coinmarketcap
Since early February, when tariff concerns began to escalate, the index has shown a consistent downward trend, reaching levels not seen in several years. This drop in confidence has added to the uncertainty surrounding the resilience of the crypto market amid current macroeconomic events. If sentiment continues to deteriorate, Bitcoin may remain under pressure in the short term, as investors move toward safer assets. This could continue to fuel selling bias on BTC.
Bitcoin Technical Outlook
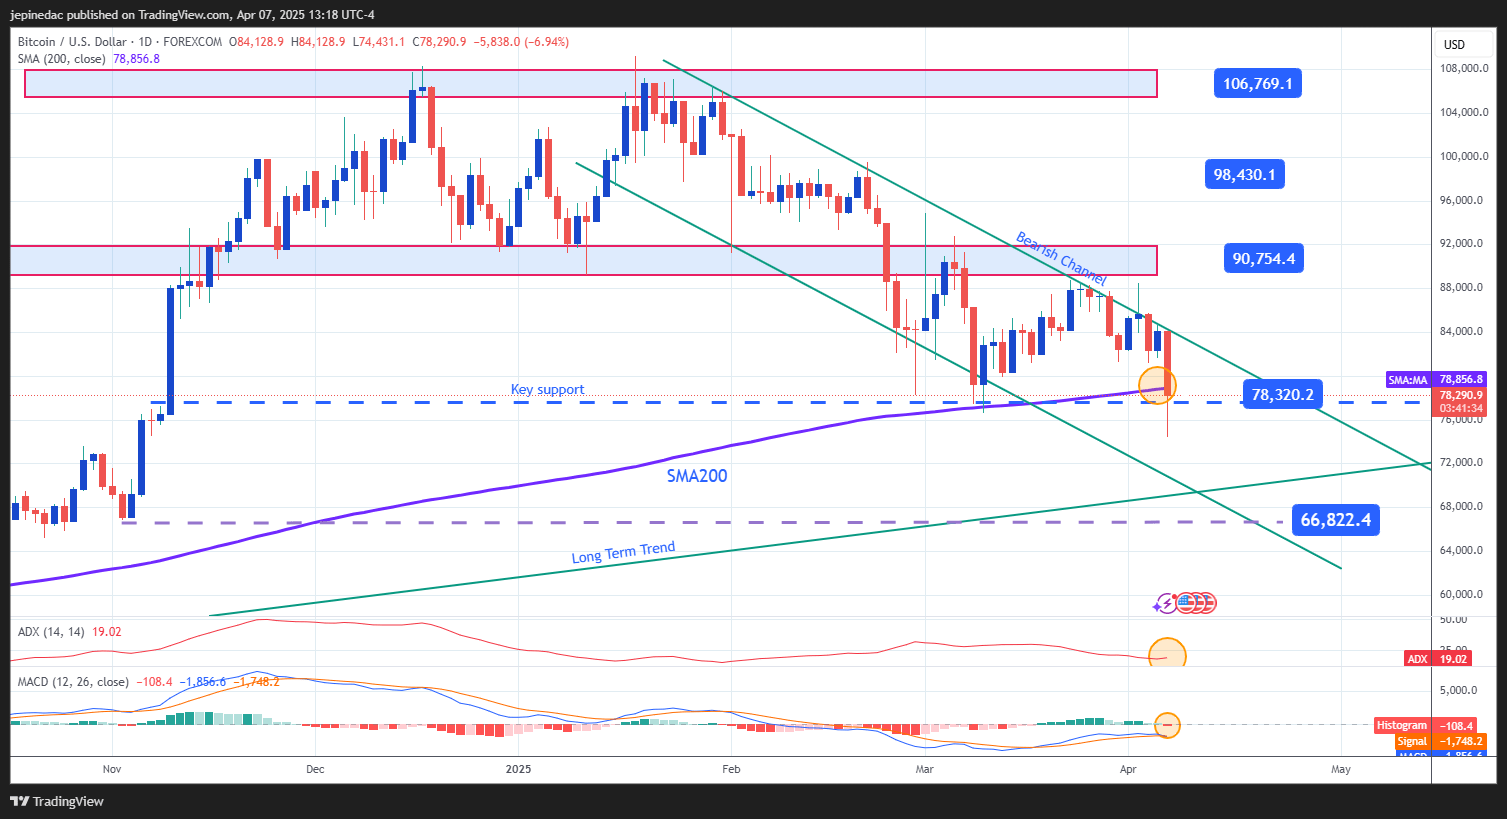
Source: StoneX, Tradingview
- Bearish Channel: Since January 20, BTC has been forming a descending channel, driving the price down to around $74,000. Currently, the price is struggling to hold above a key technical support, while market momentum continues to show a dominant bearish bias. So far, no upward breakout has emerged to threaten the current structure, making the channel the most relevant formation on the chart for now.
- ADX: The ADX line is once again approaching the neutral 20 level. If it crosses this threshold in the short term, it may signal a strengthening of the current trend, which remains bearish for now.
- MACD: The MACD histogram recently crossed below the zero line, confirming that the momentum of recent moving averages is now aligned with a bearish bias. If the histogram continues to move further below zero, this could be a sign of sustained selling pressure that may continue to weigh on BTC price action.
Key Levels:
- $90,000 – Major Resistance: This level previously acted as significant support but now serves as key resistance. A bullish breakout above it could revive buying interest and potentially trigger a more sustained recovery, challenging the current bearish setup.
- $78,000 – Intermediate Resistance: This level aligns with the 200-period moving average and is currently being tested. Consistent trading below this zone could reinforce the current bearish bias and solidify the descending channel.
- $66,000 – Key Support: This is the lowest price recorded since November 2024. A break below this level could lead to a deeper bearish move, with implications for the medium to long-term trend.
Written by Julian Pineda, CFA – Market Analyst
Latest market news
September 18, 2025 02:48 PM
June 23, 2025 01:22 PM
June 23, 2025 10:39 AM
June 20, 2025 05:23 PM
June 20, 2025 04:46 PM
June 20, 2025 03:35 PM

May 28, 2025 03:30 PM

May 16, 2025 08:50 AM

April 17, 2025 11:48 AM

March 27, 2025 04:35 PM