

British Pound Talking Points:
- It’s been a grinding past four weeks for GBP/USD, with a major spot of resistance coming into play around the 1.3400 handle that bulls haven’t yet been able to take out.
- GBP/JPY on the other hand has been in the midst of a decisive bullish trend following the ascending triangle break in late-April.
- I’ll be looking at both pairs in the weekly webinar and you’re welcome to join. Click here to register.

While it’s been four weeks of recovery in the U.S. Dollar now, GBP/USD has held its own as the major pair has built into a box. Resistance has so far held at a familiar spot, around the 1.3414 Fibonacci level that held the highs in Q3 of last year. Between those two resistance tests, we can see a V-shaped formation as a consistent sell-off turned into a decisive bullish trend that’s now been stalled for almost a full month.
GBP/USD Weekly Price Chart
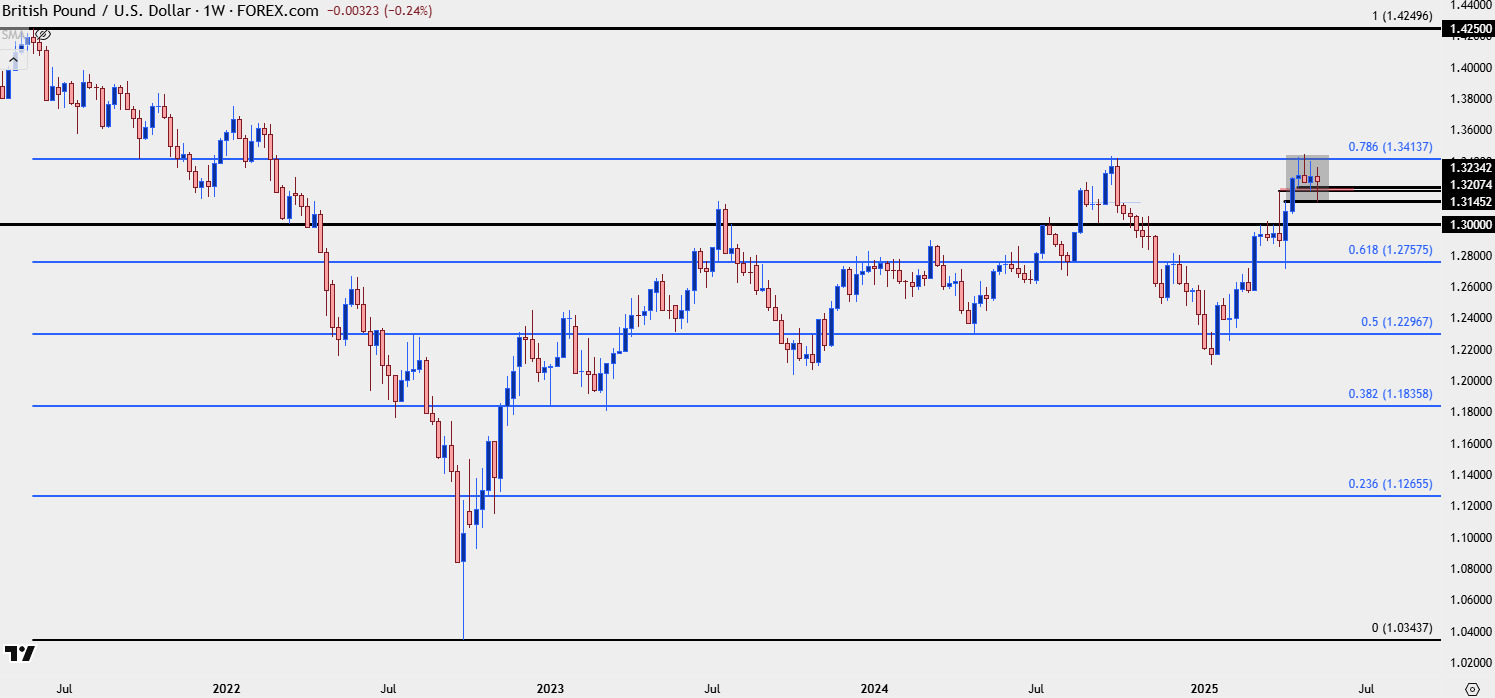 Chart prepared by James Stanley; data derived from Tradingview
As I looked at in the webinar on Friday, GBP/USD remains one of the more attractive major pairs for USD-weakness themes, in my opinion. The quandary with that is that from the daily chart, we can see a recent patterning of lower-lows and lower-highs, which keeps the door open for a larger pullback. In that case, there is a significant spot of interest around the 1.3000 handle that was resistance in March; but hasn’t yet been re-tested as support since the breakout.
Alternatively, bulls showing up to produce a higher-low next week could re-open the door for topside, with a very obvious point of resistance at the Fibonacci level of 1.3414. Above that is perhaps an even more contentious level at 1.3500 and this would be follow-through resistance in breakout scenarios.
For that higher-low, there’s a big spot of support potential in the prior swing zone from around 1.3207-1.3234.
GBP/USD Daily Chart
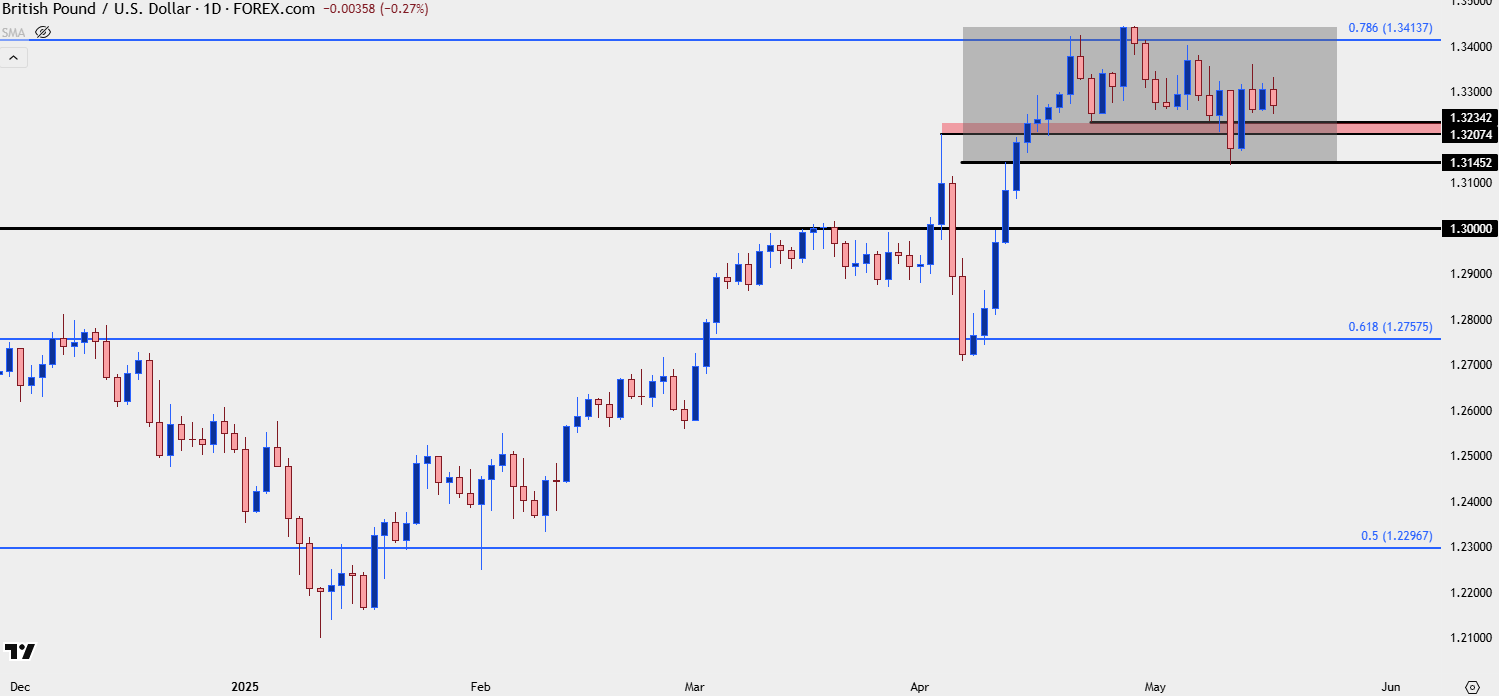 Chart prepared by James Stanley; data derived from Tradingview
GBP/JPY
For those looking for trending backdrops, there may be more current attraction in GBP/JPY, which tested a big level this week that bulls weren’t able to break.
I’ve been following the pair for Yen-weakness setups since the ascending triangle breakout at 190.00 in late-April. Since then bulls have continued to press both higher-highs and higher-lows with this week producing a fresh four-month high. Broader Yen-weakness themes took a step back, and so did the rally in GBP/JPY, but as we wind towards the end of the week a key longer-term level remains in-play as higher-low support as taken from prior resistance.
I had looked into this on Thursday and then again in the Friday webinar, and for both GBP-strength and JPY-weakness themes, this remains of attraction for next week.
GBP/JPY Daily Price Chart
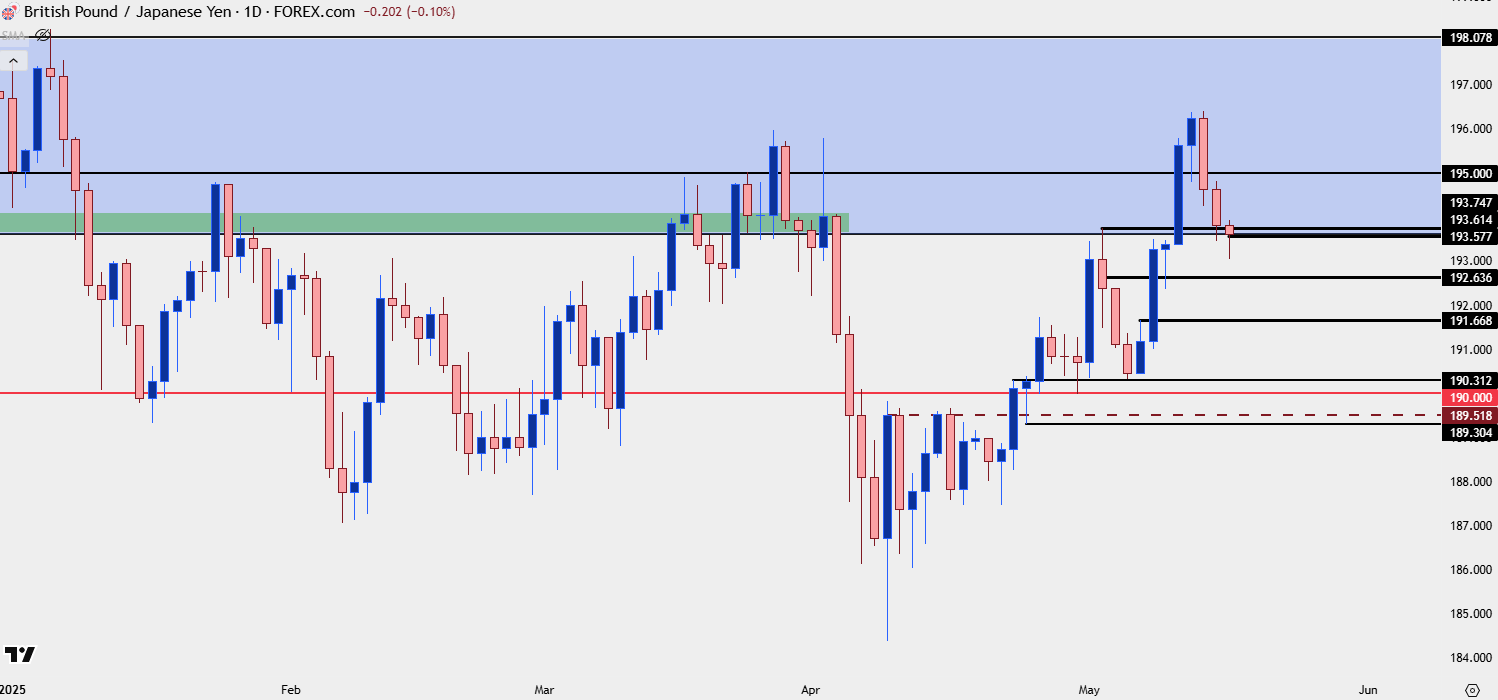 Chart prepared by James Stanley; data derived from Tradingview
--- written by James Stanley, Senior Strategist
Latest market news
Yesterday 06:26 PM
Yesterday 04:30 PM
Yesterday 02:42 PM
Yesterday 12:42 PM

Yesterday 11:00 AM

May 22, 2025 03:30 PM

May 22, 2025 11:14 AM

May 21, 2025 05:02 PM