

British Pound Talking Points:
- It was another sideways week for Cable even as the Bank of England cut rates again.
- The weekly range for GBP/USD remained in the same vicinity as the prior two weeks, with resistance holding around 1.3400.
- GBP/JPY on the other hand printed its fourth consecutive green week after an aggressive defense of the 185.00 level a month ago.
- EUR/GBP continues to moderate, and this week saw prices push back below the psychologically important .8500 level.

It’s been an indecisive month of May so far for the British Pound but on a bigger picture basis, potential remains for bulls as price has continued to hold very near a key point of resistance. Last week saw the Bank of England cut rates, but sellers couldn’t make any progress below the 1.3200 handle and this helped to keep prices pinned towards that longer-term resistance, around 1.3400.
GBP/USD Monthly Chart
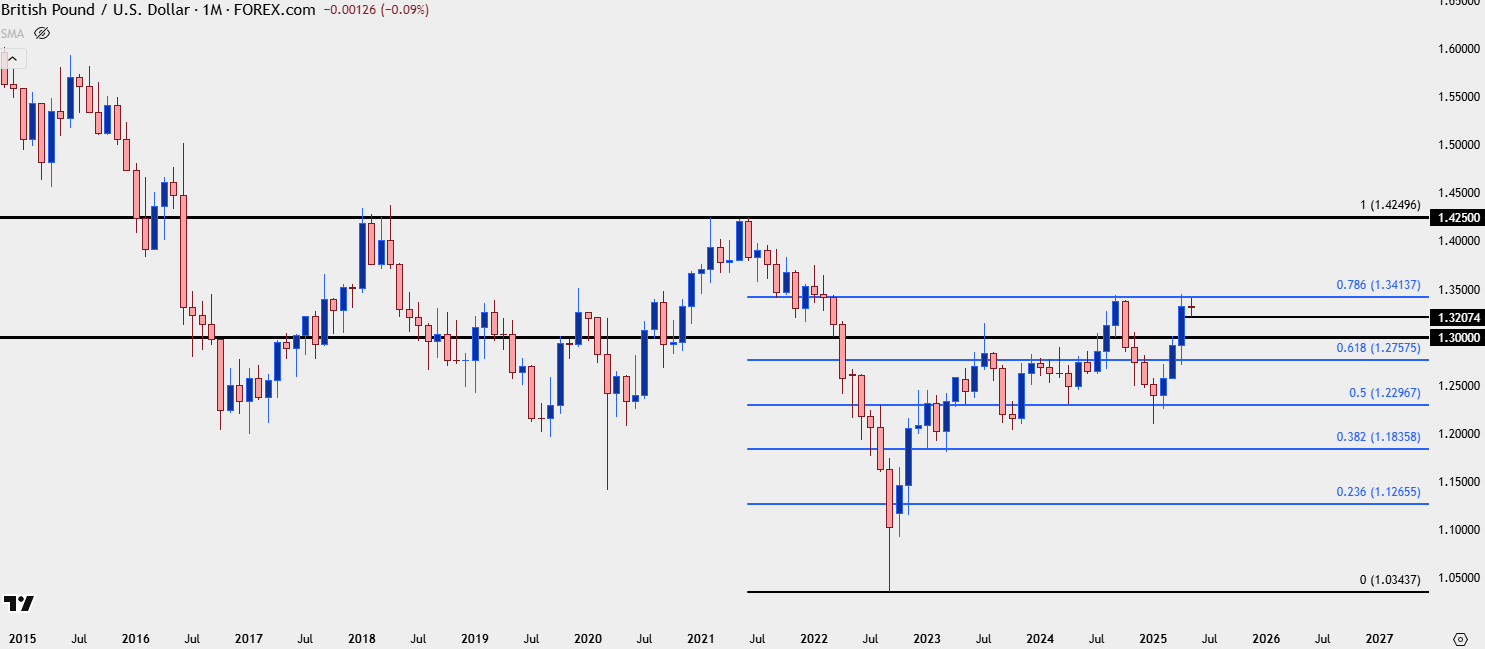 Chart prepared by James Stanley; data derived from Tradingview
GBP/USD Weekly
The weekly chart of GBP/USD highlights a v-shaped reversal with lows in early-2025 trade. While EUR/USD had taken out the 2024 highs of 1.1200, GBP/USD remains at the same spot that held bulls back in Q3 of last year at 1.3414, or the 78.6% Fibonacci retracement of the 2021-2022 major move.
The continued hold of that resistance wouldn’t necessarily eliminate bullish potential, however, as buyers have so far showed up to support the move, particularly last week when prices pulled back for a test of support at prior resistance with the 1.3207 level remaining respected. This is a difficult area to chase but at this point, especially given relative performance against EUR/USD, I would continue to track GBP/USD with aims of bullish potential for USD-weakness scenarios. The next significant resistance overhead is the 1.3500 psychological level which is likely at least part of the reason for the stalling at 1.3414 over the past few weeks.
GBP/USD Weekly Chart
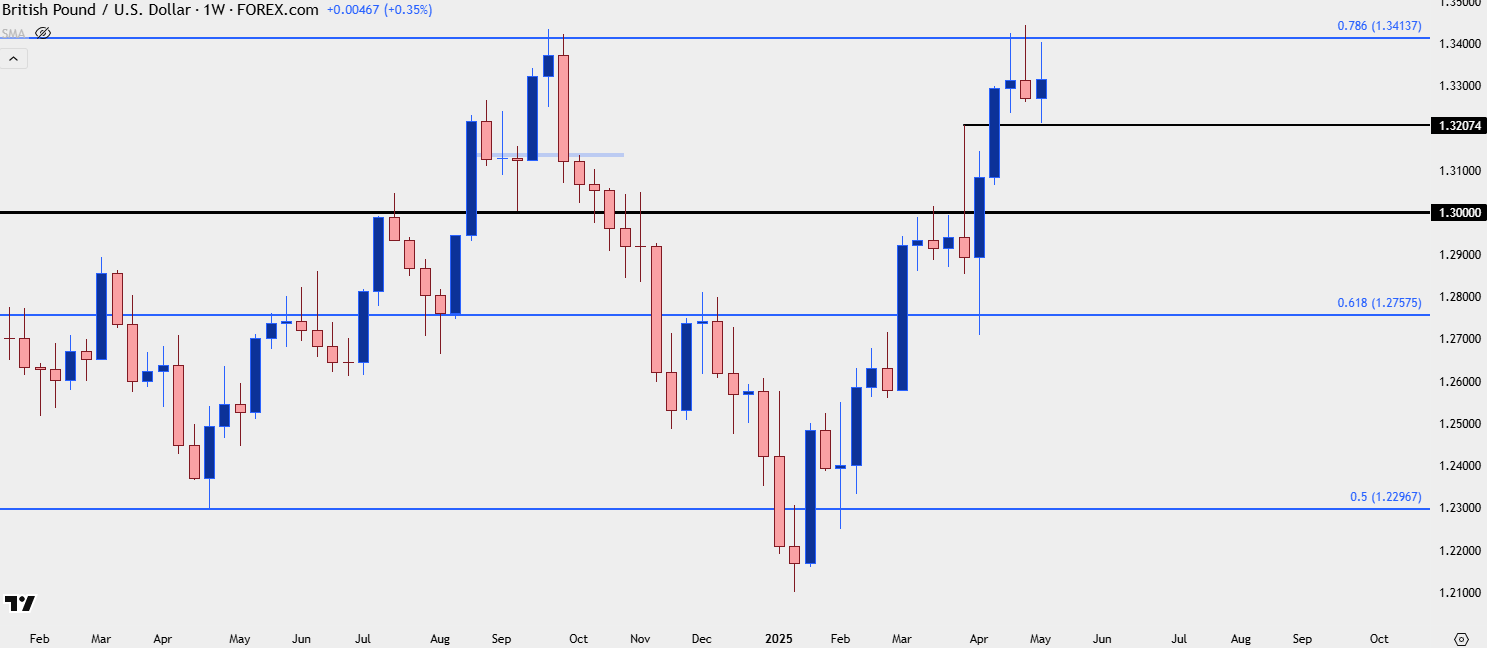 Chart prepared by James Stanley; data derived from Tradingview
GBP/USD Daily
The GBP/USD daily chart illustrates that hold of support at prior resistance which can keep bulls in order for next week, but it’s also worth pointing out that price did push down to a fresh May low in early-Friday trade before bulls responded.
This sets the stage where an early-week pullback next week, with a hold of a higher-low near the top of the 1.3207-1.3234 zone could open the door for bullish continuation.
For those looking to work with near-term strength scenarios in the British Pound, there may be more amenable pastures elsewhere, as I’ll look at below with GBP/JPY.
GBP/USD Daily Price Chart
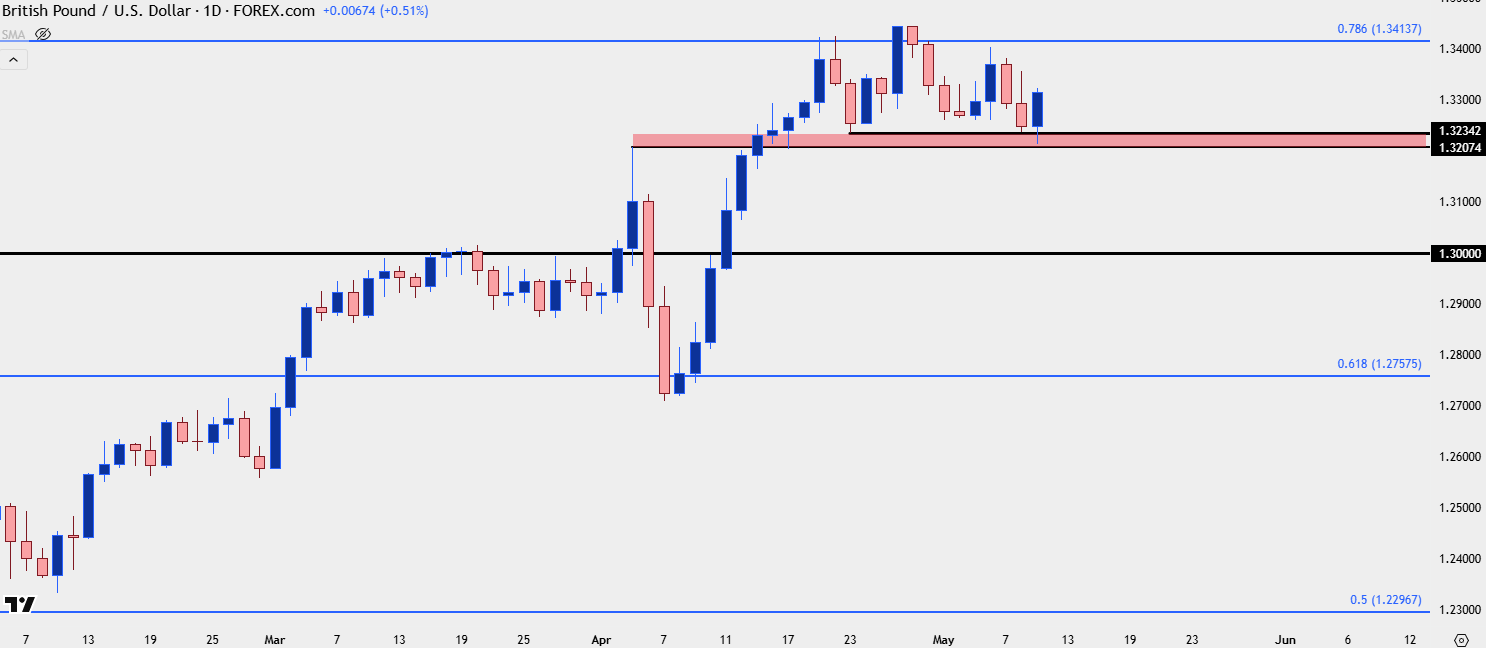 Chart prepared by James Stanley; data derived from Tradingview
GBP/JPY
The weekly chart of GBP/JPY has been strong for the past four weeks following the bullish defense of 185.00. Perhaps more notable is how buyers have responded to support, especially over the past two weeks, with the 190.00 handle holding the lows two weeks ago and then 190.31 setting support for last week. At this point the 193.61 level which marks the bottom of the gap from back in 2008, remains as resistance. But, above that, if bulls can begin to budge above, the 195.00 handle appears followed by the top of that gap up to 198.08.
GBP/JPY Weekly Price Chart
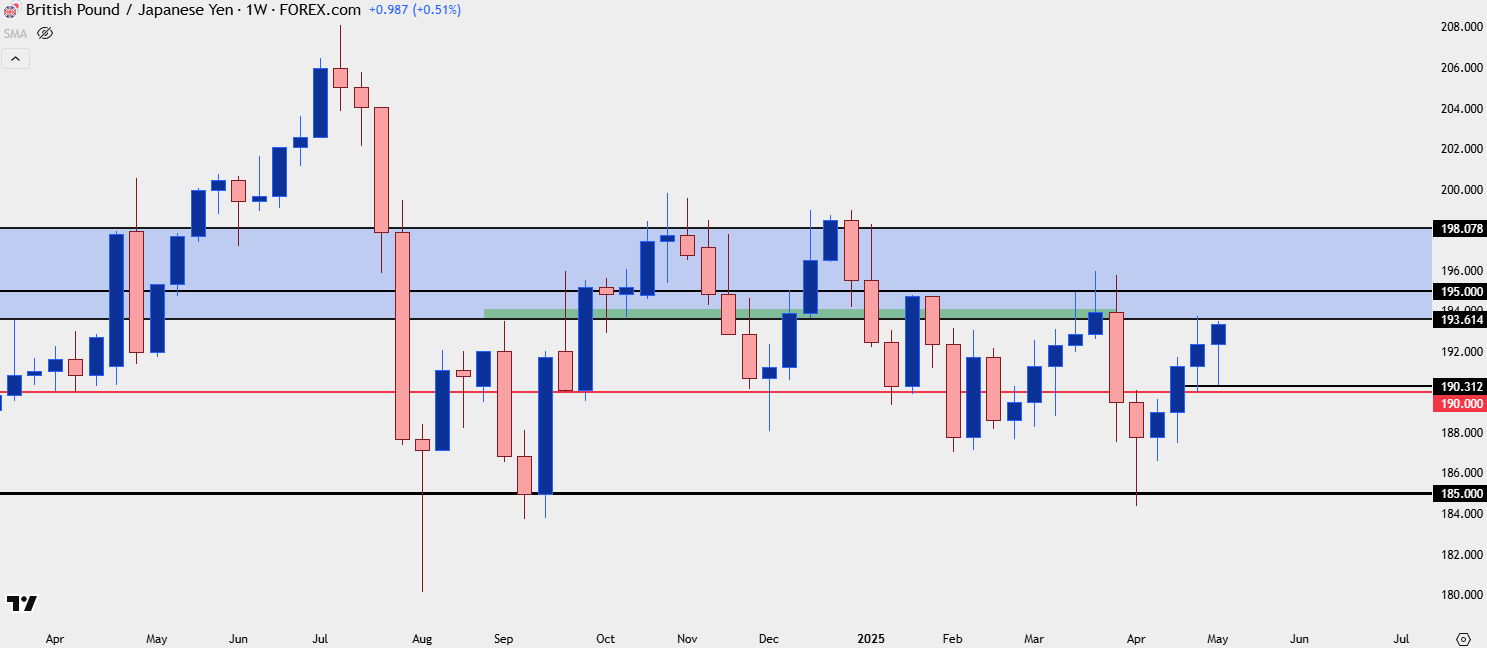 Chart prepared by James Stanley; data derived from Tradingview
GBP/JPY Shorter-Term Strategy
I’ve been following this setup quite closely and on Thursday I published an article highlighting support in the pair at 192.64, which later helped to hold support as prices bounced back towards recent highs. Before that, it was support structure around the 190.00 level as an ascending triangle in the pair had started to give way.
I would still be cautious of chasing this one too aggressively as the Yen has shown a penchant for setting traps this year, both on the bullish and bearish side. But given a clear spot of resistance overhead from around 193.61-193.75, there’s a clear line in the sand. For those that are aggressive and that do not want to wait, that could produce breakout potential into the 195.00 handle. For those that are looking to treat more cautiously, looking for resistance to hold in that area followed by a pullback and then a higher-low could be a more appropriate way forward. Or, alternatively, if that resistance does not come into play, and instead a deeper pullback shows, the same 191.67 level could be looked to as a form of support.
GBP/JPY Four-Hour Price Chart
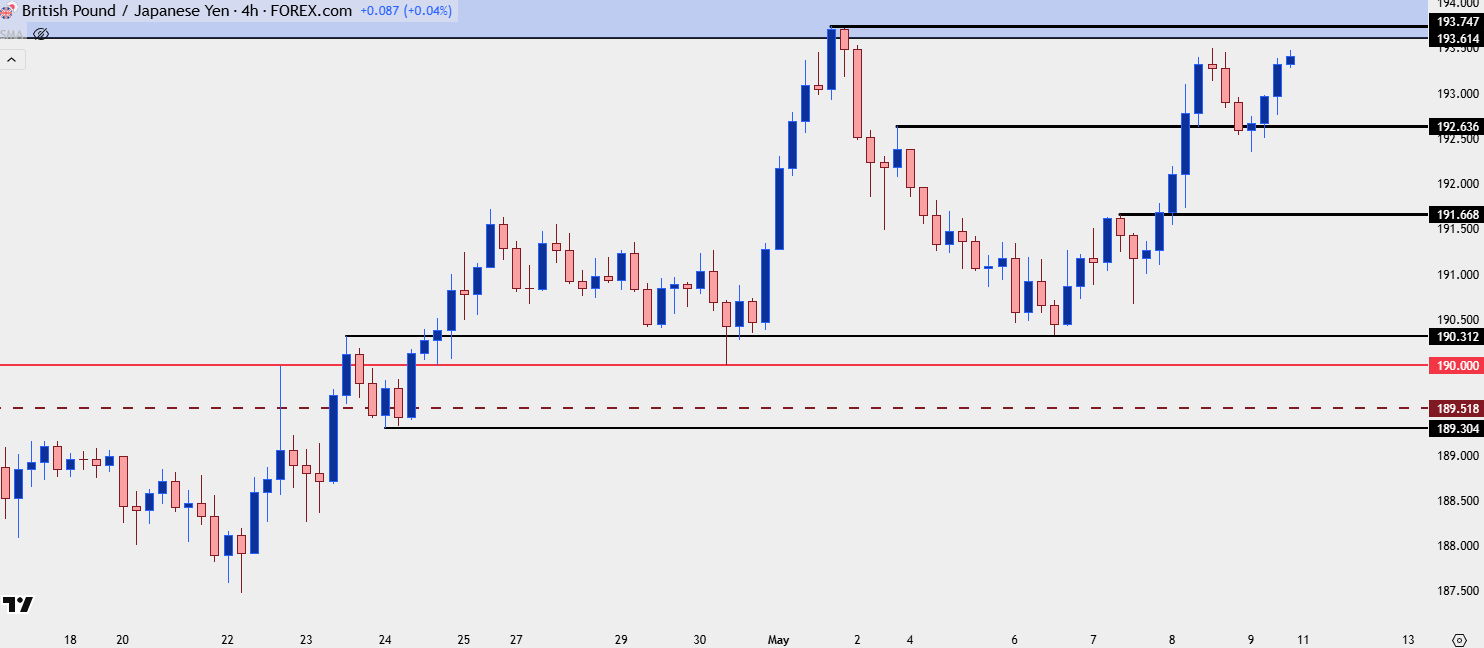 Chart prepared by James Stanley; data derived from Tradingview
EUR/GBP
The normally sleepy natural cross of EUR/GBP has shown some significant volatility so far this year, at least on a relative basis. After funneling into a falling wedge in the second-half of last year, bulls posed a strong breakout in the pair that eventually erased 61.8% of the trend that had taken two years to build. But that price is where the music began to stop, around the .8700 handle, and for the past four weeks sellers have been clawing back the move.
Last week was significant as this is when price finally took out the .8500 handle after two weeks of support around that price, and this opens the door for a deeper slide down towards the 23.6% Fibonacci retracement of the 2023-2024 major move, plotted at .8401. Perhaps more interesting is the prospect of lower-high resistance at the .8500 handle which can keep the door open for short-term bearish trend continuation in the pair.
EUR/GBP Weekly Price Chart
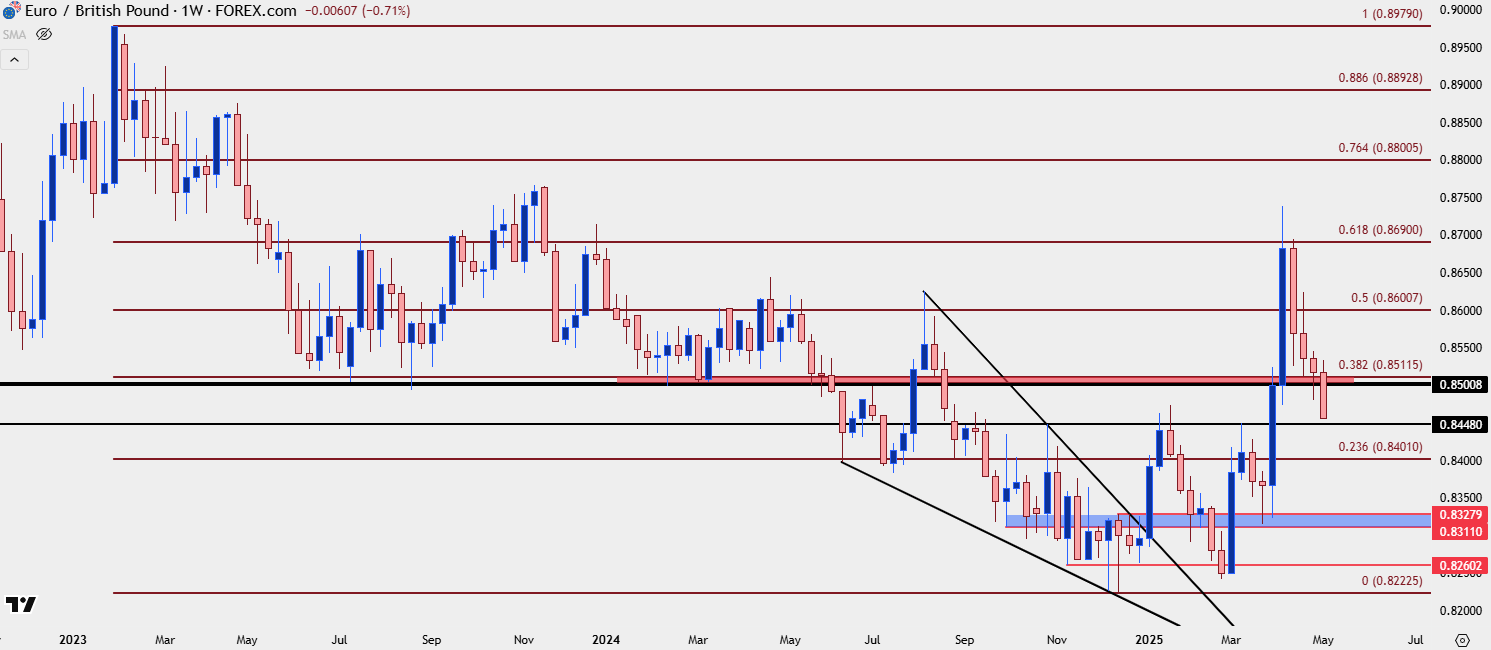 Chart prepared by James Stanley; data derived from Tradingview
--- written by James Stanley, Senior Strategist
Latest market news
September 18, 2025 02:48 PM
June 23, 2025 01:22 PM
June 23, 2025 10:39 AM
June 20, 2025 05:23 PM
June 20, 2025 04:46 PM
June 20, 2025 03:35 PM

May 14, 2024 01:20 AM
August 18, 2023 01:36 AM

August 17, 2023 11:05 PM

October 26, 2022 01:00 PM