

Canadian Dollar Talking Points:
- The initial reaction in the US Dollar was weakness after this morning’s CPI report, and that prodded a short-term lower-low in the USD/CAD pair.
- Bigger picture, USD/CAD has continued to show reticence at or around lows, helping to build a falling wedge formation as RSI divergence has appeared on the daily chart. These are both items suggesting the possibility of pullback but that’s just a potential scenario, at this point.
- I look into USD/CAD during each price action webinar, and you’re welcome to join the next. Click here to register.

At this point it’s difficult to argue a bullish case on USD/CAD, as all that can be argued on the long side of the pair is a case of deduction. Yesterday produced a bearish engulfing candlestick and ever since the failed breakout in early-February, it’s been patterning lower-lows and lower-highs, save for a pullback in late-April and early-May that saw strident defense from sellers of the psychological 1.4000 level.
As I’ve been saying through much of this, USD/CAD remains as one of the more attractive venues for USD-weakness to play out as the longer-term range in the pair very much remains in order. That range over the past near-decade has shown a penchant for resistance around the 1.4000 and 1.4500 levels, and those are the prices that had significant impact in the pair in the first five months of this year.
USD/CAD Monthly Chart

Chart prepared by James Stanley; data derived from Tradingview
The challenge at this point is how one-sided the move has become, and at the end of the day, the biggest push point for market prices is supply and demand or buying and selling rather than some overriding fundamental or technical reason for why one or the other should happen. As the old saying goes, if a market fails to move up on good news, then look out below. Well, the reason for that is that if anyone willing and able to get long already is, even the brightest news in the world fails to bring more demand. And without demand, price stalls, or starts to move lower. And then as price moves lower even with the backdrop of good news, current longs start to second guess their positions, leading to some of those longs to close positions. They close positions by selling which means more supply for little to no demand, and that drops prices even more.
Before you know it, we have a counter-trend rally taking place even as the backdrop is seemingly optimistic for bullish continuation. This is the story of positioning and it’s highly relevant in market environments.
This is also perhaps why USD bulls were thwarted back in early-February, even after the print of fresh multi-decade highs. And more recently, it’s been at least part of the reason why sellers were stalled at 1.3750 in May and then 1.3650 in June.
This doesn’t mean that prices must pullback, as I’ll look at in a moment, but it does make the prospect of chasing downside breakouts as a more dangerous proposition as the imbalance in positioning that comes along with a stalled move shows counter-trend potential.
USD/CAD Daily Chart
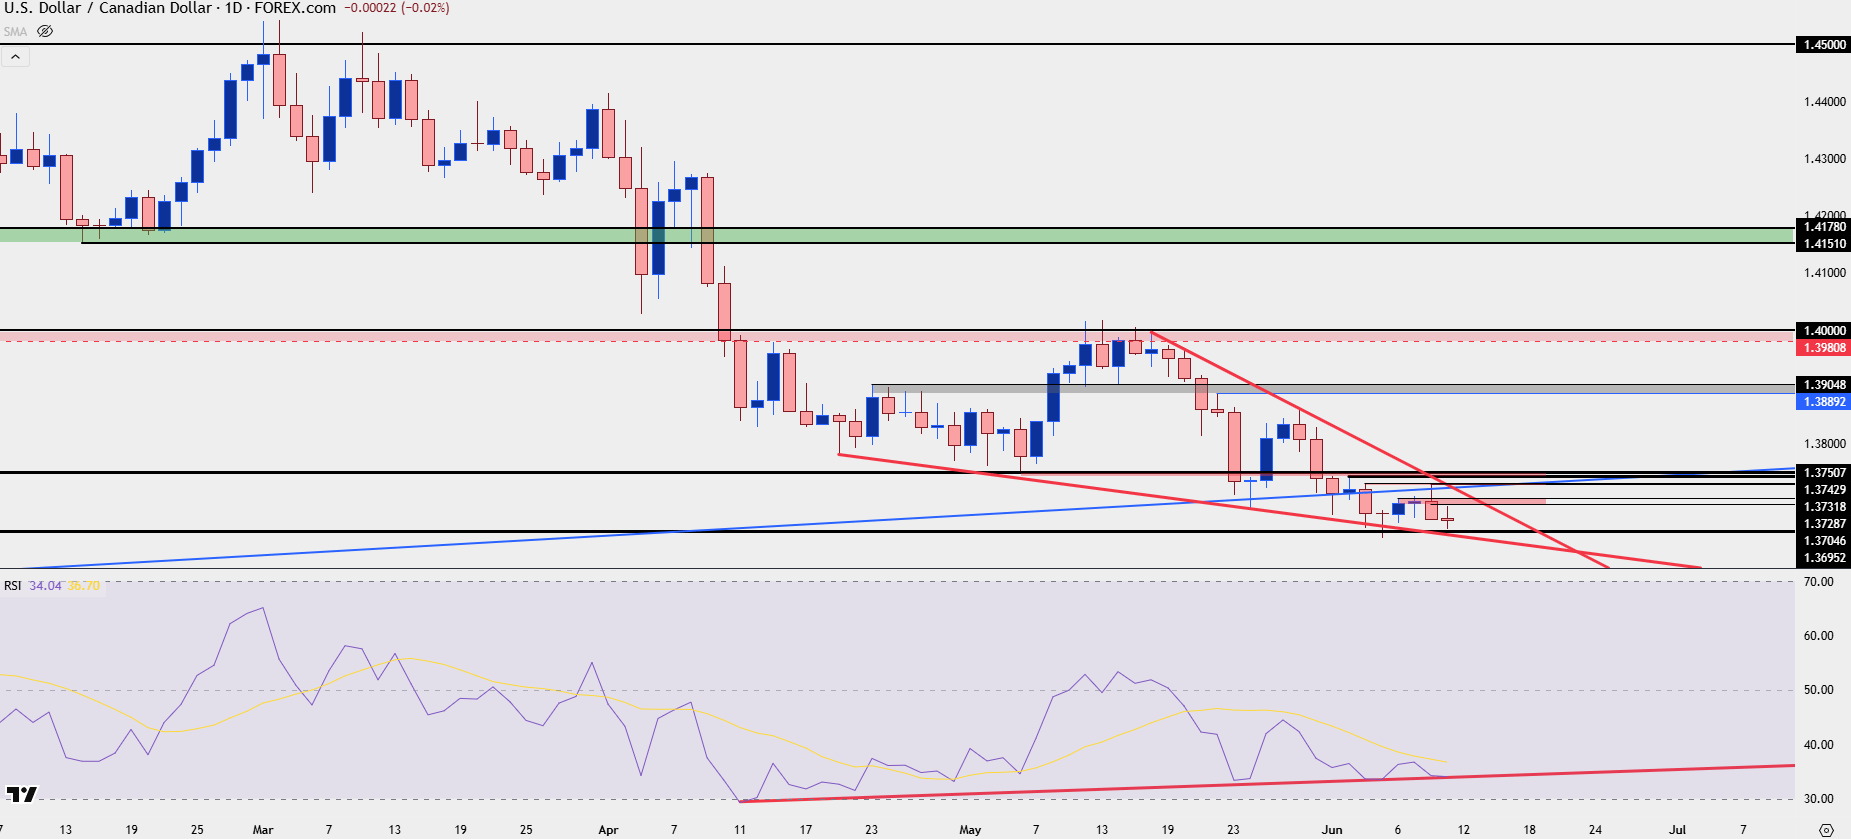
Chart prepared by James Stanley; data derived from Tradingview
USD/CAD Short-Term Strategy
Trading forecasts are difficult and the reason is fairly obvious, nobody has a crystal ball. About the best we can do is use the available evidence to create a hypothesis and, at least in my opinion, focus instead on risk and trade management as more controllable variables in an otherwise unpredictable world. This is what I teach in the Trader’s Course and it remains relevant across possible setups and strategies.
For USD/CAD, given the diverging RSI on the daily and the falling wedge formation, this presents pullback potential, similar to what I had talked about last Friday. That led into a pullback to start this week, with price finding resistance at a confluence of trendlines yesterday morning and that led to the build of a bearish engulfing candlestick on the above daily chart.
So I would still qualify this as bearish, but I would hesitate to chase price this close to recent lows and this far away from the prior swing-high. Instead, I want to look for lower-high resistance and there’s a couple of spots of interest for such. Short-term, there’s the 1.3700 zone that was in-play last week. I’m considering this as an ‘r1’ zone of resistance. Above that, the swing-high from earlier in the week presents an ‘r2’ zone of resistance from 1.3728-1.3731, and above that, we have the 1.3750 zone that was resistance and a lower-high last week, after showing as support in early-May.
If bulls can pose a bounce above all three of those areas, then we would have a bullish break of the falling wedge formation and the door would open for a larger pullback. In that scenario, I would anticipate more attractive bullish USD backdrops elsewhere, such as EUR/USD, but there’s a few steps to fill in before that outcome can be entertained.
USD/CAD Four-Hour Chart
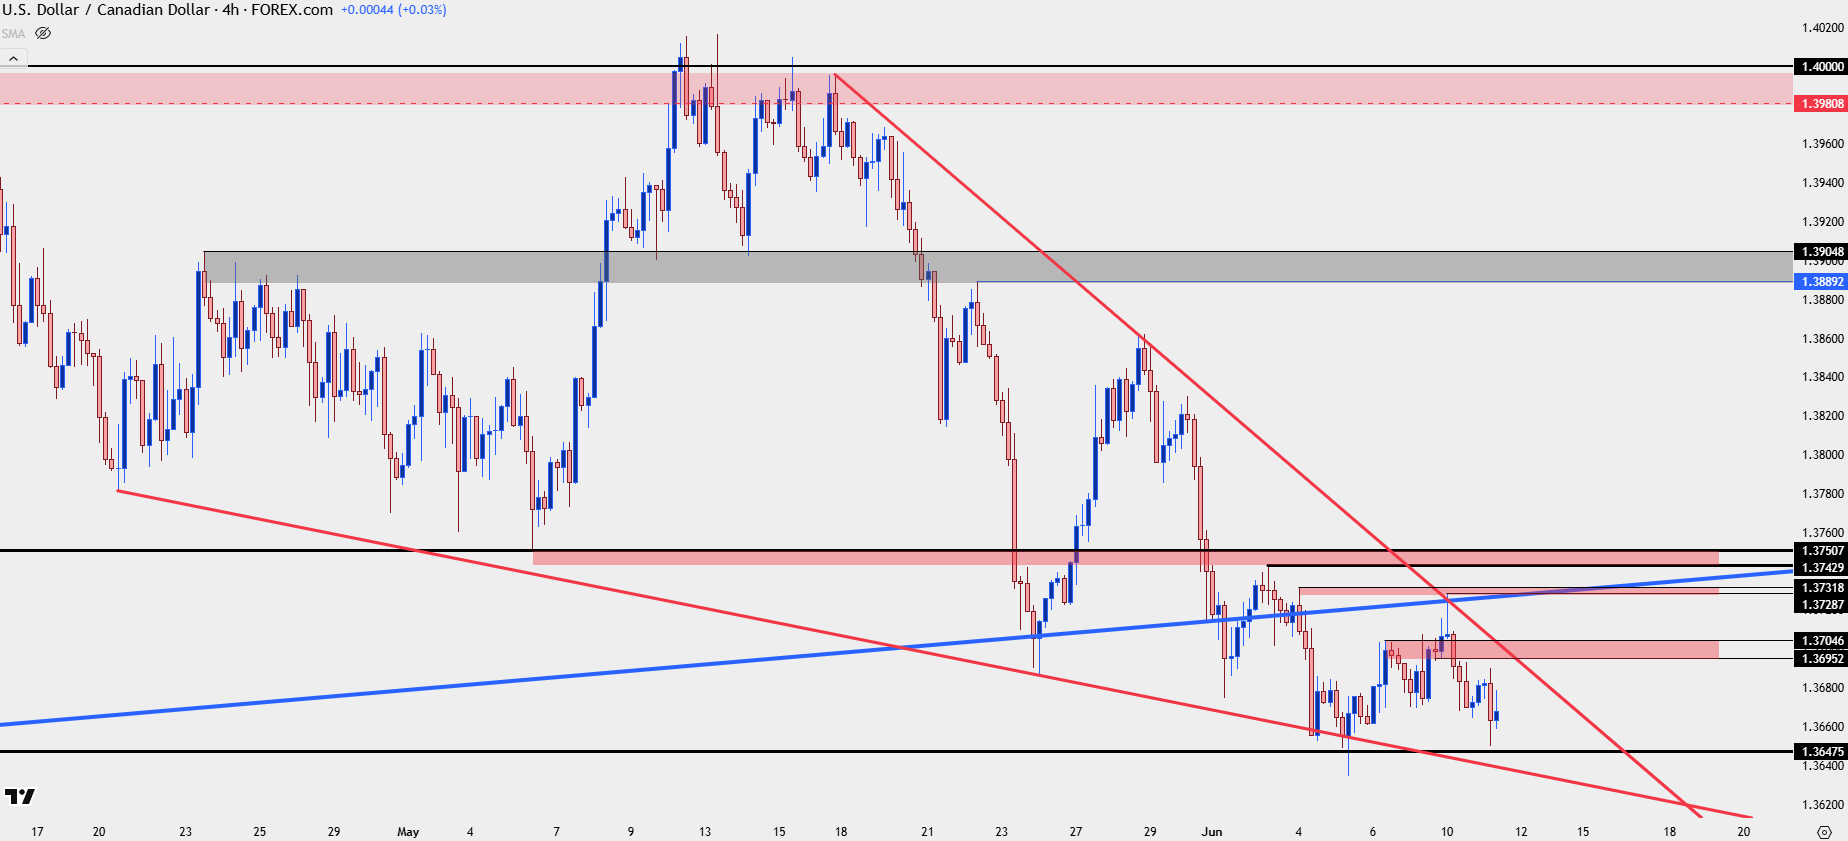 Chart prepared by James Stanley; data derived from Tradingview
--- written by James Stanley, Senior Strategist
Latest market news
September 18, 2025 02:48 PM
June 23, 2025 01:22 PM
June 23, 2025 10:39 AM
June 20, 2025 05:23 PM
June 20, 2025 04:46 PM
June 20, 2025 03:35 PM

June 5, 2025 05:32 PM

May 22, 2025 03:08 PM

May 20, 2025 04:48 PM
May 17, 2025 02:00 PM