

Canadian Dollar Technical Forecast: USD/CAD Weekly Trade Levels
- USD/CAD Seven-week plunge now testing confluent support at multi-year uptrend
- USD/CAD risk for exhaustion / price inflection ahead– U.S Core PCE / NFP on tap
- Resistance 1.3947/78, 1.4168 (key), 1.4292– Support 1.3729/95 (key), 1.3504/23, 1.3360
The Canadian Dollar is threatening to snap a seven-week winning streak with USD/CAD plummeting more than 5.2% off the March highs. The decline takes USD/CAD into critical support and the immediate focus is on a reaction off this mark into the close of the month. Battle lines drawn on the USD/CAD weekly technical chart.
Review my latest Weekly Strategy Webinar for an in-depth breakdown of this Loonie setup and more. Join live on Monday’s at 8:30am EST.Canadian Dollar Price Chart – USD/CAD Weekly

Chart Prepared by Michael Boutros, Sr. Technical Strategist; USD/CAD on TradingView
Technical Outlook: In last month’s Canadian Dollar Technical Forecast we noted that USD/CAD had, “USD/CAD reversed off confluent uptrend resistance last week with the decline breaking below the September uptrend. From a trading standpoint, look to reduce short-exposure / lower protective stops on a drop towards the median line (1.4175)- rallies should be limited to 1.4383 IF price is heading lower on this stretch.” USD/CAD registered an intraweek low at 1.4151 days later before rebounding with the rally briefly extended into the 2016 high-close at 1.4538.
The subsequent decline has extended more than 6.8% off the yearly high with USD/CAD now testing a key support confluence at 1.3729/95- a region defined by the 38.2% retracement of the 2021 advance and the 61.8% retracement of the late-2023 advance. Note that the 2022 trendline converges on this zone over the next few weeks and further highlights the technical significance of this threshold. Looking for possible price inflection off this mark.
Initial weekly resistance is eyed with the 52-week moving average / 2022 swing high at 1.3947/78 and is backed by the 38.2% retracement of the yearly range at 1.4168. A breach / close above this threshold would be needed to suggest a more significant low is in place / a larger reversal is underway toward the high-week close at 1.4292 and the yearly open at 1.4383.
A break / weekly close below this key pivot zone threatens another bout of accelerated declines with the next major technical consideration seen at 1.3504/23- a region defined by the 1.618% extension of the February decline and the 78.6% retracement. Subsequent objectives seen at the 2024 low-week close (LWC) at 1.3360 and the 2023 LWC at 1.3218.

Bottom line: A three-month sell-off takes USD/CAD into technical support at a multi-year uptrend- risk for possible downside exhaustion / price inflection here. From a trading standpoint, a good zone to reduce short exposure / lower protective stops- rallies should be limited to 1.4168 IF price is heading lower on this stretch with a close below 1.3729 needed to mark resumption off the January downtrend.
Keep in mind we get the release of key U.S. inflation data (Core PCE) and Non-Farm Payrolls into the monthly cross. Stay nimble into the releases and watch the weekly closes for guidance. I’ll publish an updated Canadian Dollar Short-term Outlook once we get further clarity on the near-term USD/CAD technical trade levels.
US/ Canada Economic Data Release
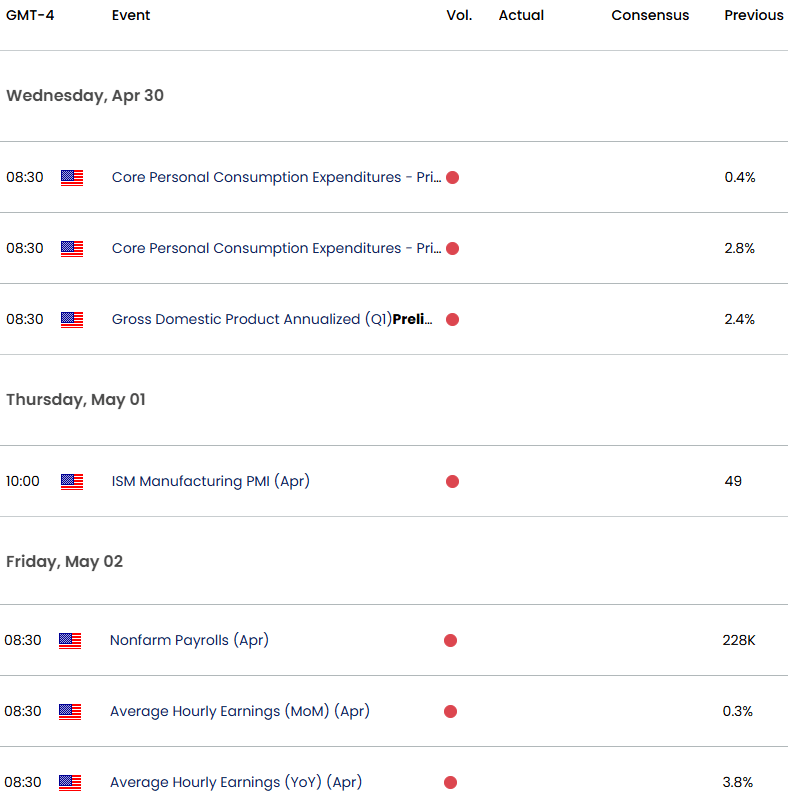
Economic Calendar - latest economic developments and upcoming event risk.
Active Weekly Technical Charts
- Euro (EUR/USD)
- US Dollar Index (DXY)
- Australian Dollar (AUD/USD)
- British Pound (GBP/USD)
- Japanese Yen (USD/JPY)
- Gold (XAU/USD)
- S&P 500, Nasdaq, Dow
- Crude Oil (WTI)
--- Written by Michael Boutros, Sr Technical Strategist with FOREX.com
Follow Michael on X @MBForex
Latest market news
September 18, 2025 02:48 PM
June 23, 2025 01:22 PM
June 23, 2025 10:39 AM
June 20, 2025 05:23 PM
June 20, 2025 04:46 PM
June 20, 2025 03:35 PM

June 9, 2025 09:32 AM

May 12, 2025 06:44 AM
April 27, 2025 02:00 PM