

Canadian Dollar, USD/CAD Talking Points:
- The sell-off in USD/CAD was aggressive in April and the pair remains one of the more attractive major pairs for scenarios of USD-weakness.
- The bigger question is whether U.S. Dollar bears can take back control after a strong bounce over the past few weeks. Notably, USD/CAD has held resistance at the same spot that I’ve been looking for, around the 23.6% retracement of the sell-off which is confluent with the 1.4000 handle. Explored in full detail below.
- I look into both the U.S. Dollar and USD/CAD during the weekly price action webinar. Click here to register.

Now that USD/CAD has pulled back, the big question is whether sellers pounce as a major spot of confluent resistance has come into play.
The sell-off in April was smooth yet aggressive, and even as the USD started to show symptoms of a turn around Easter Monday, USD/CAD continued to grind into support. But bears were losing power and price was starting to show potential for pullback in the pair, as a falling wedge formed to go along with divergent RSI on the daily chart. When I looked at this in the webinar last week, I had highlighted two different zones of resistance that could give bears opportunity to jump in after a bit of re-setting had taken place, and the 1.4000 handle was a logical spot to look for that to happen.
So far, it has, as Monday saw a quick test above the big figure and that was followed by a second trip above yesterday. At this point that resistance remains in-play as sellers have taken a stand, and this illustrates continued bearish control of the short-side trend on the daily chart.
USD/CAD Daily Chart

Dollar Dilemma
As with any major pair the sway of the U.S. Dollar matters and at this point, the USD holds continued potential on the long side as we’ve so far seen a hold of higher-low support after the week began with another higher-high.
Longer-term, there is still question as to whether sellers can re-take the trend as the USD had gotten very oversold in late-April, to the point where pulling fresh sellers into the mix to drive to fresh lows could be a challenge. And now that we have a pullback, there’s an opportunity for bears to show up and continue that trend. But we pretty much need to be focusing on weekly charts for that scenario as the daily USD chart shows continued higher-low support after a higher-high. The weekly, however, has about half of the week to go before the current candle completes, but as you can see, it’s been a hard reaction to the 102.00 level that I looked at in last week’s webinar, with the candle displaying a form of indecision.
US Dollar Weekly Chart
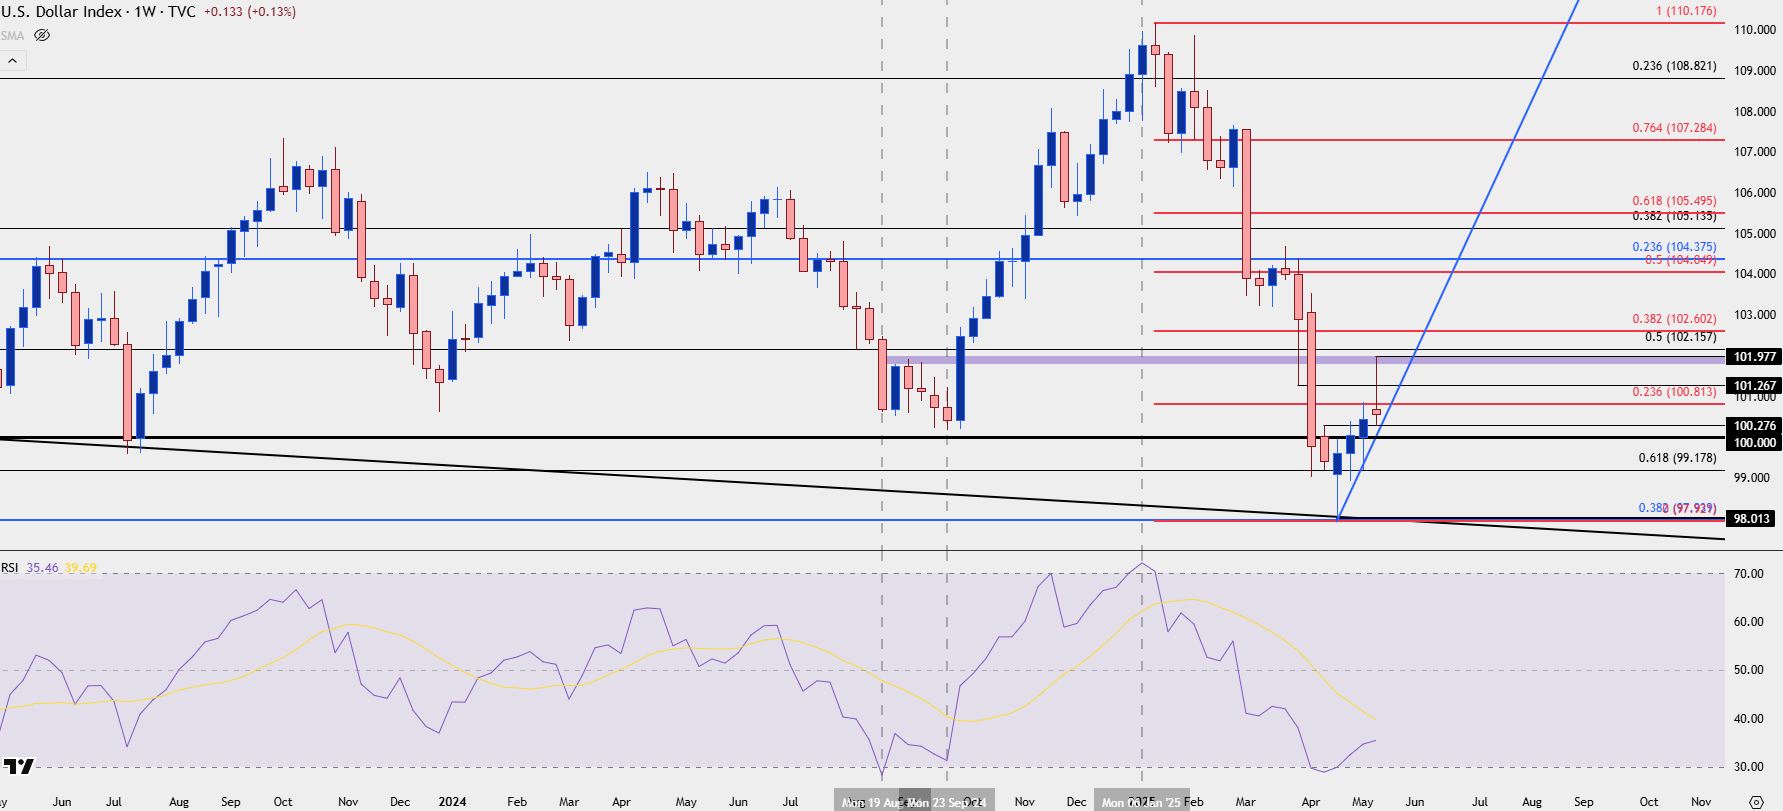 Chart prepared by James Stanley; data derived from Tradingview
From the shorter-term daily or four-hour chart, a bullish argument can still be made as we’ve seen a hold of support at prior resistance. And in DXY, the 100-level continues to loom large, which is nearing confluent with an upward-sloping trendline projection.
This is important – because it seems unlikely for the USD and USDCAD trend to diverge too greatly, at this point, and for those that are looking for either USDCAD or USD weakness, breaking this recent sequence of higher-highs and lows is an important first step to sellers wrestling back control.
US Dollar Four-Hour Chart
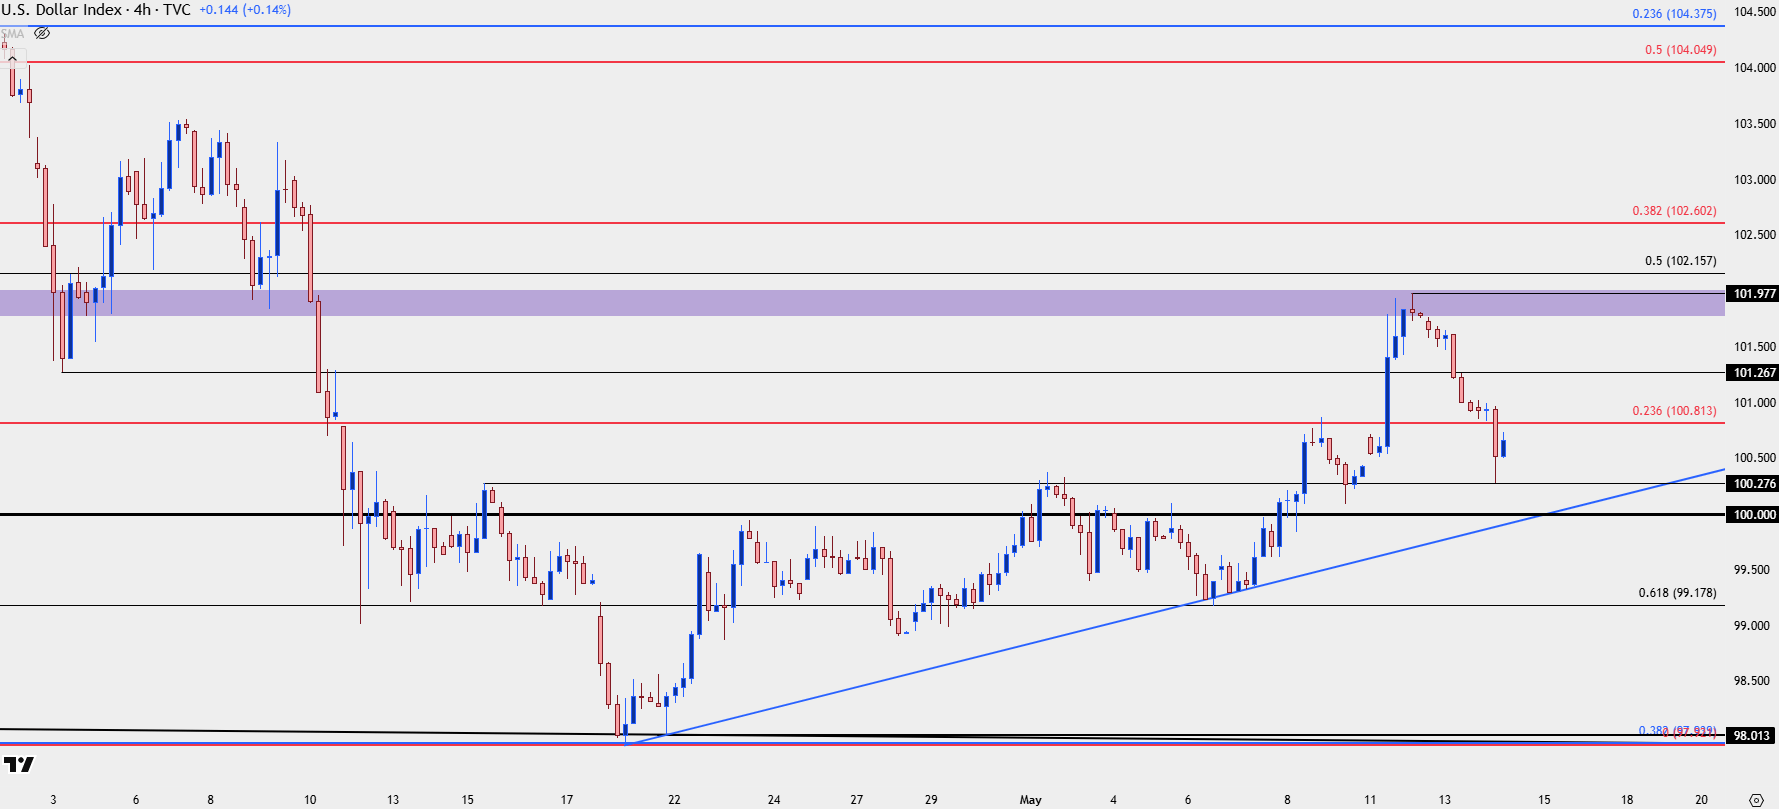 Chart prepared by James Stanley; data derived from Tradingview
USD/CAD Bigger Picture
At this point I retain the view that USD/CAD is an attractive and perhaps even optimal pairing for USD-weakness scenarios. There’s a few reasons for that, chief of which is the longer-term range that remains in-play on the pair. That’s a big statement after a tenuous few months saw USD/CAD threaten a significant breakout at multi-decade highs. But perhaps even bigger was sellers regaining control to get back below the 1.4000 handle, and then continuing to drive without even a mild pullback, until last week.
Ever since the breakdown I’ve been talking about a 1.4000 re-test and it took almost a month for it to happen, but now that it’s here, we’ve seen sellers defend the level and this retains bearish potential. It will need some help from the broader USD move, and it’s always best to plan for contingencies; so if we do see USD bulls continue to press, then it’s the 1.4150-1.4178 zone in USD/CAD that sits as next key resistance. This is around the 38.2% Fibonacci retracement of the 2025 sell-off and that represents a major waypoint for the pair as it was also prior support before the breakdown came into play.
USD/CAD Weekly Chart
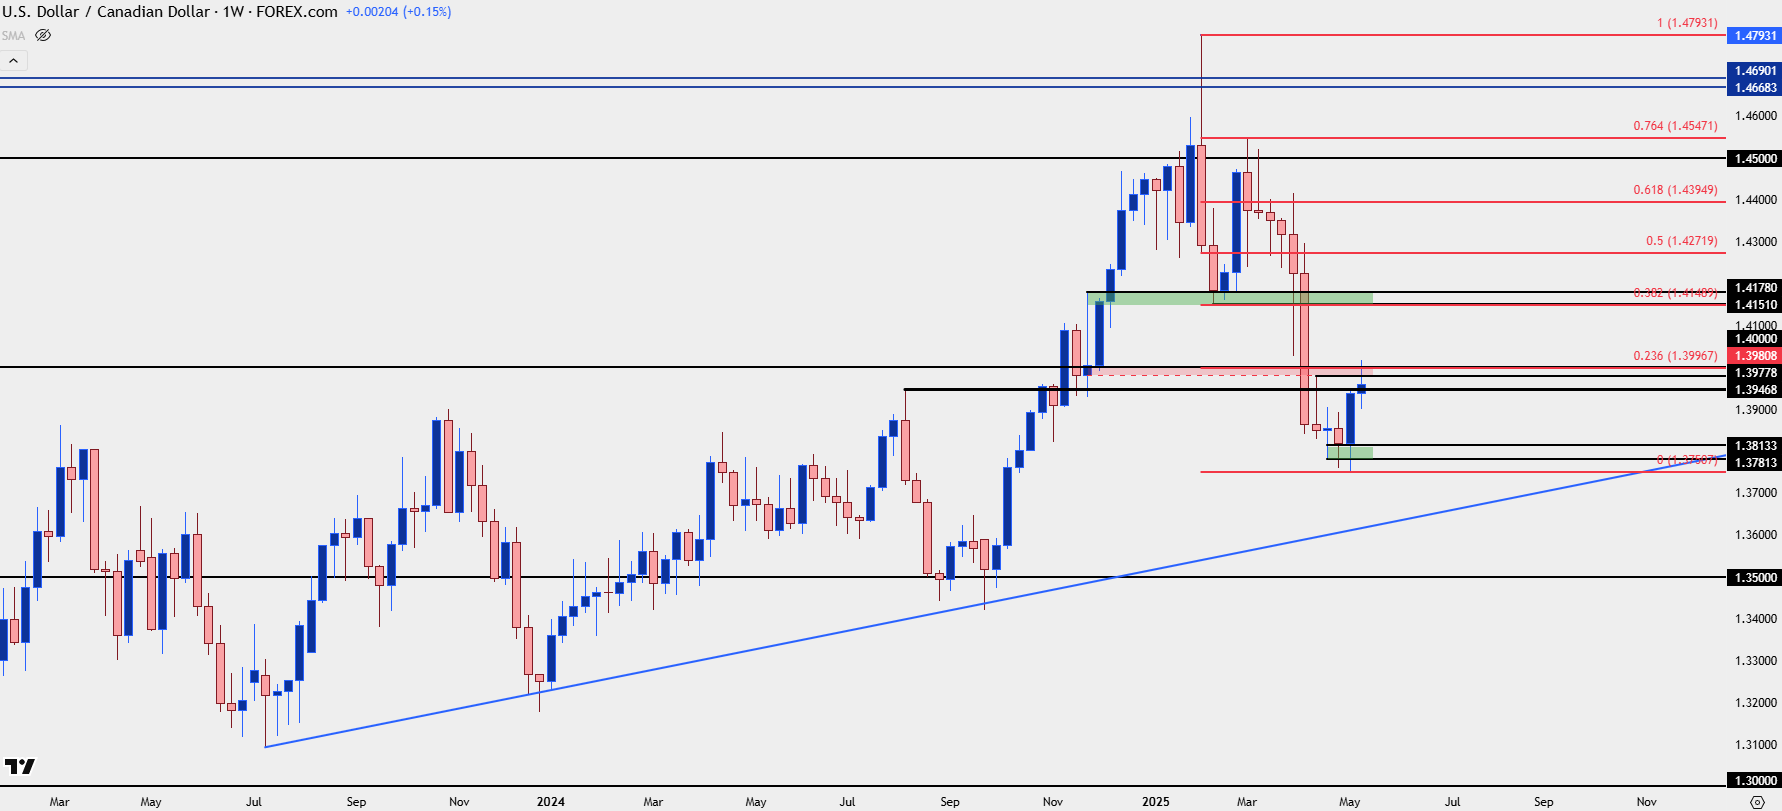 Chart prepared by James Stanley; data derived from Tradingview
USD/CAD Shorter-Term Structure
Trends take place on timeframes in different ways and shorter-term trends, while often less consistent, can turn into intermediate and then longer-term trends, such as we saw with the bearish turn in USD/CAD during March and April.
The beauty of price action is that its objective, and you can’t really argue against it; it just comes down to a simple matter of perspective and that’s where subjectivity can begin to creep in as we can all see the same picture from a slightly different lens (or time frame).
From the four-hour chart we can see sellers rebuked at the 1.4000 level which then led to the sell-off back to a prior spot of resistance-turned-support, at 1.3905. That so far has held and there’s a couple of different way to move forward on this.
Firstly, for bears, another lower-high would be necessary to keep the market in a bearish short-term state. And given the two prior pokes above 1.4000, ideally that lower-high would arrive inside of the 1.4016 level.
But given the two tests and holds of 1.3905, a double bottom formation can be argued – which is a bullish breakout formation. For that formation to come to life we would need a break of the neckline of the formation (the high between the two lows), which is that 1.4016 price.
So not only would the bearish trend be nullified with a higher-high, but the double bottom would trigger at that point – both bullish items. That would then point to a move that’s approximately the size of the distance from the bottom to the neckline, in this case, about 101 pips, which would imply a push towards 1.4117, getting very close to that next resistance zone at 1.4149-1.4178.
USD/CAD Four-Hour Chart
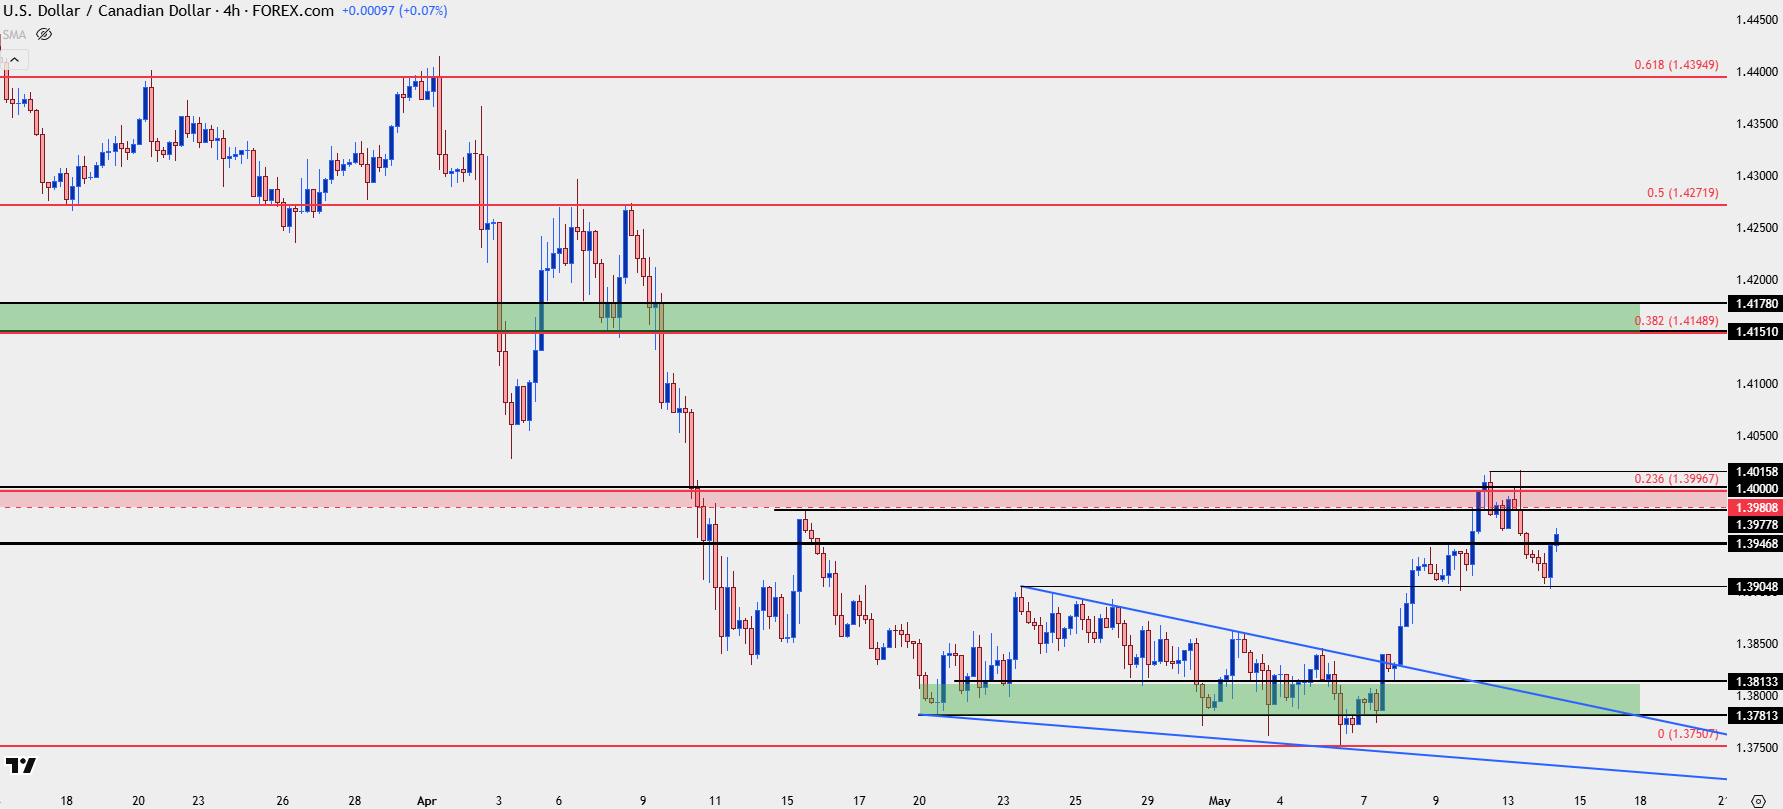 Chart prepared by James Stanley; data derived from Tradingview
--- written by James Stanley, Senior Strategist
Latest market news
September 18, 2025 02:48 PM
June 23, 2025 01:22 PM
June 23, 2025 10:39 AM
June 20, 2025 05:23 PM
June 20, 2025 04:46 PM
June 20, 2025 03:35 PM

September 18, 2025 02:48 PM

June 18, 2025 08:37 PM

June 13, 2025 06:22 PM

June 12, 2025 03:40 PM