

Canadian Dollar, USD/CAD Talking Points:
- April has been a very bearish month for USD/CAD but the bulk of those losses were within the first 11 days. Since then, USD/CAD has held support at the 1.3846 level which remains in-play into the weekend.
- Monday brings Canadian elections, and Mark Carney is currently favored to win. Canada has six time zones and polls close at 9:30 PM, after which votes are tallied. Preliminary results may be available shortly after polls close and official results confirmed within a few days after.
- I’ll be looking into USD/CAD price action in the Tuesday webinar and you’re welcome to join: Click here for registration information.

The short-side trend has come on quickly in USD/CAD, and from a longer-term perspective this continues the range-bound backdrop that’s been in the pair for the past nine-plus years. But much like the US Dollar, the bulk of those losses were relegated to the first eleven days of the month, with USD/CAD spinning its wheels for much of the time since and with the 1.3846 level continuing to hold the lows. I had looked at that level on the 11th as that price was a swing high from a year ago; and for the past three weeks this has been support.
USD/CAD Weekly Chart
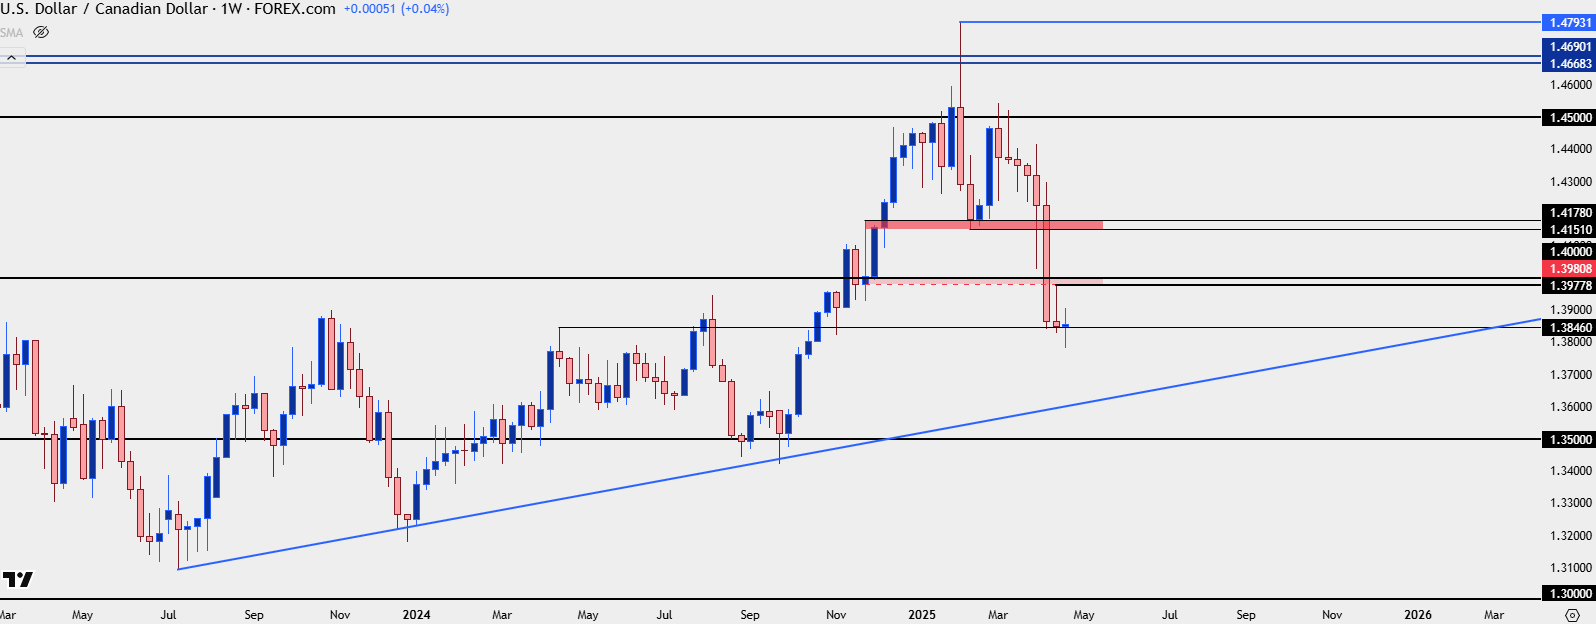 Chart prepared by James Stanley; data derived from Tradingview
USD/CAD Shorter-Term Strategy
When that 1.3846 level came into play earlier in the month, RSI on the daily was nearing oversold territory and given how aggressively bears had pushed the pair through the 1.4000 psychological level, it made for a difficult trend to chase. I talked about that in the article published at the time, instead focusing on resistance around the 1.4000 handle. And as I said then, ideally, sellers wouldn’t even allow for a 1.4000 test as bearish anticipation would hold resistance below the psychological level. So, I spanned that price down to a prior swing of 1.3980 to look for a resistance zone. Even that couldn’t come into play, however, as the swing high from that bounce was 2.2 pips shy of 1.3980, with sellers taking another swing shortly after.
But since then, bears haven’t been able to break much fresh ground as they’ve continually been caught at the 1.3846 level and that’s allowed for a couple of reversal items to show on the chart. First is a diverging RSI element with higher-lows on RSI to go along with lower-lows on price; and from a price action perspective a weak falling wedge has formed.
These items don’t necessarily mean that a low is in-place, and that price will reverse for a long time. But it does highlight that chasing the move lower from here could prove challenging and, instead, pullbacks with tests of resistance could be a more attractive way of trying to work with the move.
For that, I’m sticking to the same 1.4000 test and this time, I’d be willing to accept a test through the big figure. The more important matter would be a daily close as I’d want to see sellers respond to that test in a noticeable fashion to illustrate that they might be ready to run the trend lower again. If they can’t – then the next zone of resistance comes into play at 1.4151-1.4178. This was a big zone of resistance turned support when the pair was ranging, so another test there with a show of a swing high could make the prospect of bearish continuation attractive again.
USD/CAD Daily Price Chart
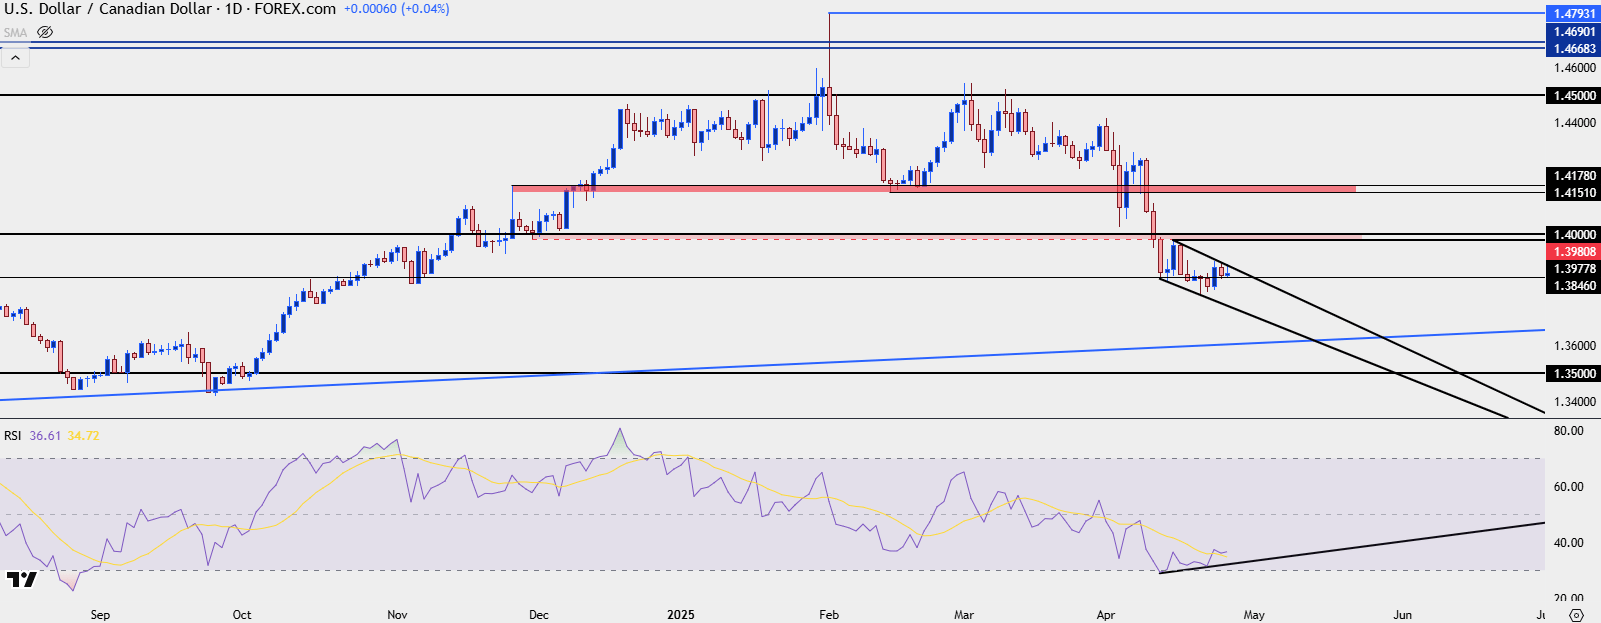 Chart prepared by James Stanley; data derived from Tradingview
--- written by James Stanley, Senior Strategist
Latest market news
September 18, 2025 02:48 PM
June 23, 2025 01:22 PM
June 23, 2025 10:39 AM
June 20, 2025 05:23 PM
June 20, 2025 04:46 PM
June 20, 2025 03:35 PM

September 18, 2025 02:48 PM

June 18, 2025 08:37 PM

June 13, 2025 06:22 PM

June 12, 2025 03:40 PM