

Canadian Dollar Outlook: USD/CAD
USD/CAD trades within the February range even as US President Donald Trump continues to adjust tariffs for Canada, but the exchange rate may further retrace the decline from earlier this month as the Bank of Canada (BoC) is expected to deliver another 25bp rate-cut.
Canadian Dollar Forecast: USD/CAD Faces BoC Rate Cut as Trump Tariffs Loom
USD/CAD seems to be defending the advance following Canada’s weaker-than-expected employment report as it carves a series of higher highs and lows, and signs of slowing job growth may push the BoC to retain the current course for monetary policy as the economy adds 1.1K jobs in February versus forecasts for a 20.0K rise.
Join David Song for the Weekly Fundamental Market Outlook webinar.
David provides a market overview and takes questions in real-time. Register Here
Canada Economic Calendar

In turn, the BoC may continue to carry out its rate-cutting cycle as the central bank acknowledges that ‘Canada’s labour market remains soft,’ and Governor Tiff Macklem and Co. may retain a dovish forward guidance as the ongoing shift in US trade policy clouds the outlook for growth.
With that said, USD/CAD may further retrace the decline from the monthly high (1.4543) as it bounces back ahead of the February low (1.4151), but a hawkish BoC rate-cut may curb the recent advance in the exchange rate as the central bank seems to be at or approaching the neutral rate.
USD/CAD Price Chart – Daily
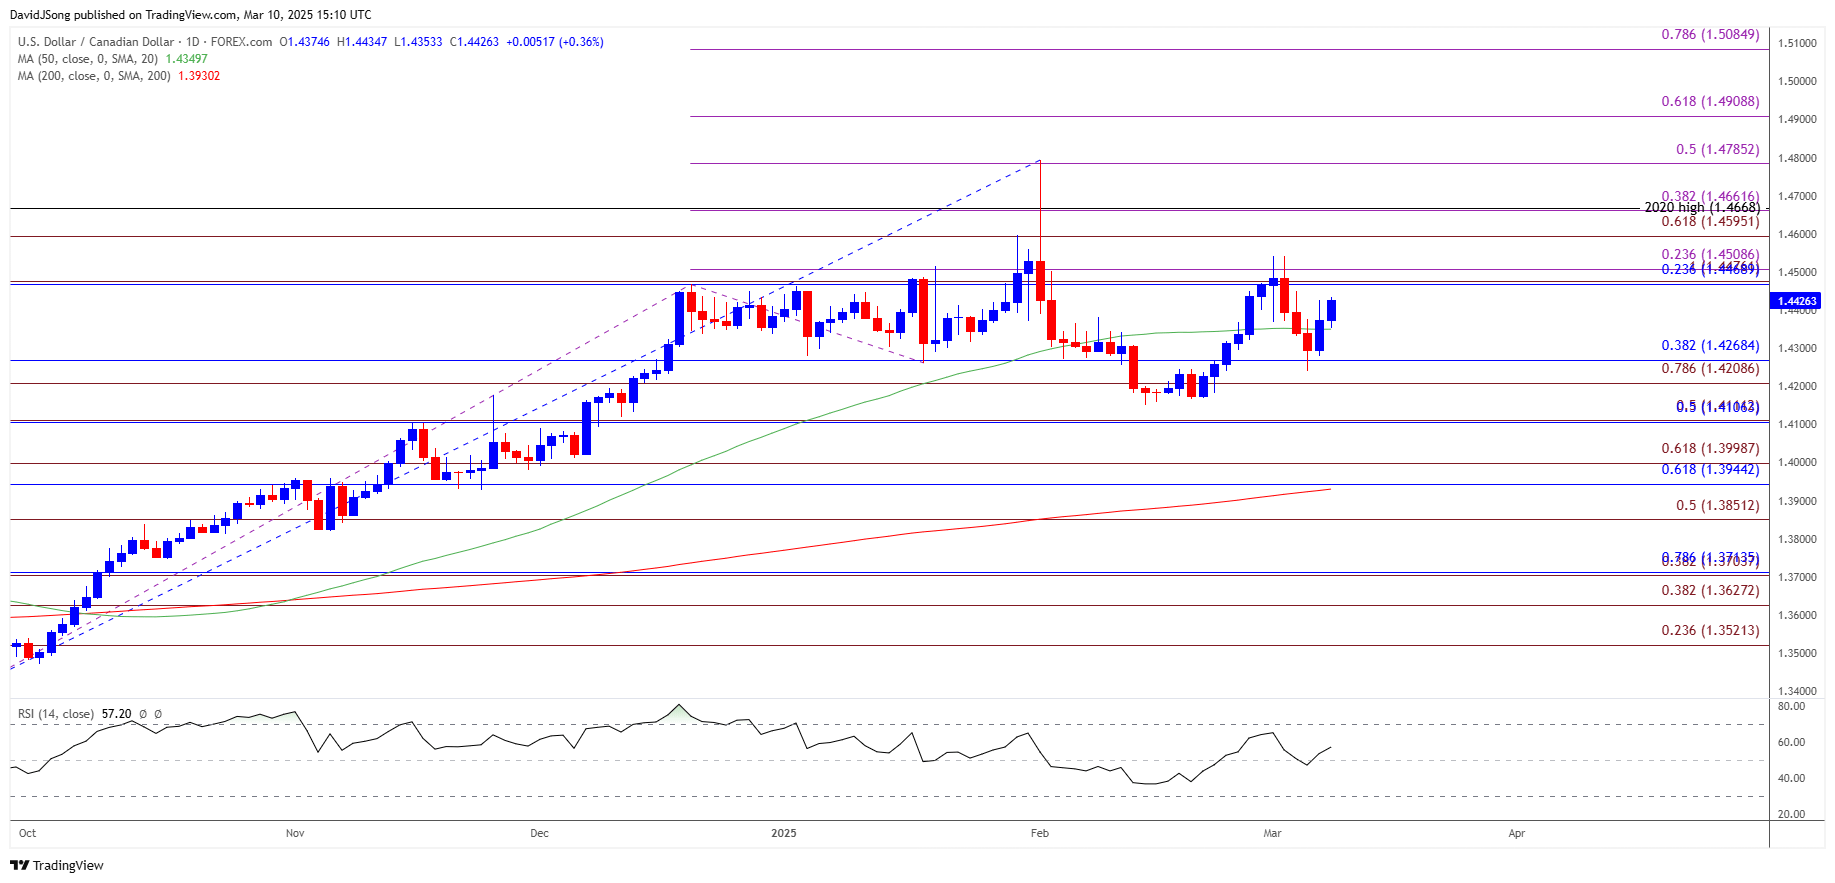
Chart Prepared by David Song, Senior Strategist; USD/CAD Price on TradingView
- USD/CAD carves a series of higher highs and lows after struggling to break/close back below the 1.4210 (78.6% Fibonacci extension) to 1.4270 (38.2% Fibonacci retracement) zone, with a breach above the 1.4470 (23.6% Fibonacci retracement) to 1.4510 (23.6% Fibonacci extension) region raising the scope for a move towards the monthly high (1.4543).
- Next area of interest comes in around 1.4600 (61.8% Fibonacci extension) to 1.4660 (38.2% Fibonacci extension), but USD/CAD may track the flattening slope in the 50-Day SMA (1.4350) if it struggles to hold above the moving average.
- Need a break/close below the 1.4210 (78.6% Fibonacci extension) to 1.4270 (38.2% Fibonacci retracement) zone to bring the February low (1.4151) on the radar, with the next area of interest coming in around 1.4110 (50% Fibonacci retracement).
Additional Market Outlooks
Gold Price Outlook Hinges on Response to Positive Slope in 50-Day SMA
US Dollar Forecast: USD/JPY Weakness Pushes RSI Towards Oversold Zone
British Pound Forecast: GBP/USD Holds Above Channel Resistance
EUR/USD Rally Persist Even as ECB Pursues Less Restrictive Policy
--- Written by David Song, Senior Strategist
Follow on Twitter at @DavidJSong

Latest market news
September 18, 2025 02:48 PM
June 23, 2025 01:22 PM
June 23, 2025 10:39 AM
June 20, 2025 05:23 PM
June 20, 2025 04:46 PM
June 20, 2025 03:35 PM

September 18, 2025 02:48 PM

June 18, 2025 07:38 PM
June 18, 2025 03:24 PM

June 17, 2025 07:15 PM