

Canadian Dollar Technical Outlook: USD/CAD Short-term Trade Levels
- USD/CAD rebounds off technical support- rally extends more than 1% post-Fed rate decision
- USD/CAD recovery now testing pivotal resistance- Canada Employment, U.S. CPI on tap
- Resistance 1.3881-1.39, 1.3978-1.4010 (key), 1.41- Support 1.3778/98 (key), 1.3714, 1.3614
The US Dollar is poised to mark a second consecutive daily advance with USD/CAD surging more than 1% off the yearly low on the heels of the Fed. A rebound off downtrend support is now approaching the top of a multi-month range in price and the first major test of the bulls. Battle lines drawn on the USD/CAD short-term technical charts.
Review my latest Weekly Strategy Webinar for an in-depth breakdown of this Loonie setup and more. Join live on Monday’s at 8:30am EST.Canadian Dollar Price Chart – USD/CAD Daily
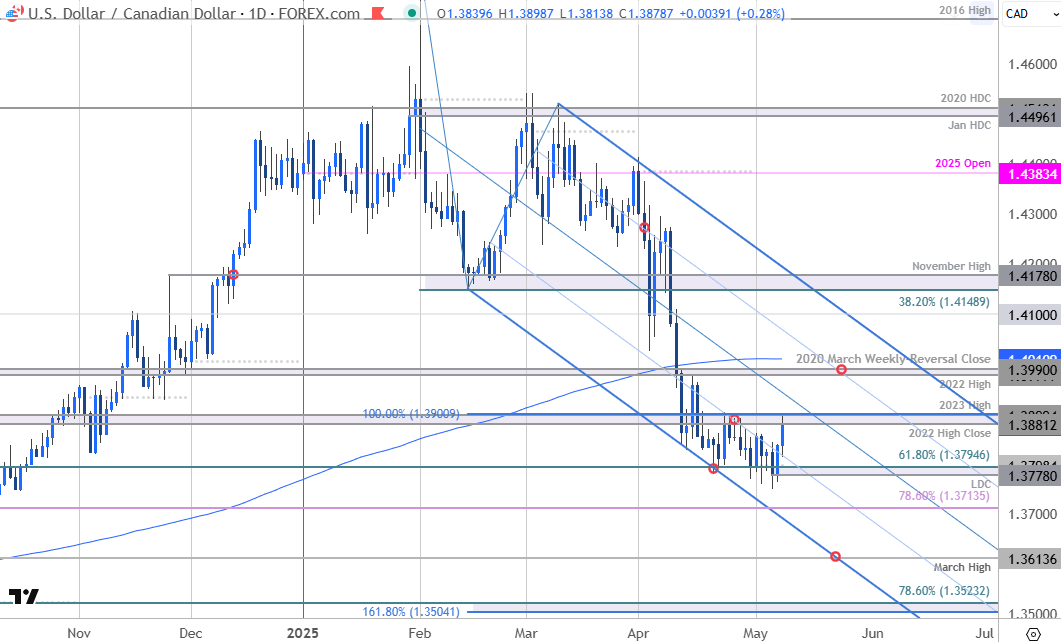
Chart Prepared by Michael Boutros, Sr. Technical Strategist; USD/CAD on TradingView
Technical Outlook: In last month’s Canadian Dollar Short-term Outlook, we noted that USD/CAD was, “in a near-term range just above downtrend support- the immediate focus is on a breakout. From a trading standpoint, rallies would need to be limited to the 200-day moving average IF price is heading lower on this stretch with a close below 1.3795 needed to mark resumption.” USD/CAD registered a low-close at 1.3778 on Tuesday before reversing sharply with the post-Fed rally now testing initial resistance at 1.3881-1.39- a region defined by the 2022 high close, the 2023 swing high, and the 100% extension of the February decline. The focus is on possible price inflection off this zone into the close of the week.
Canadian Dollar Price Chart – USD/CAD 240min
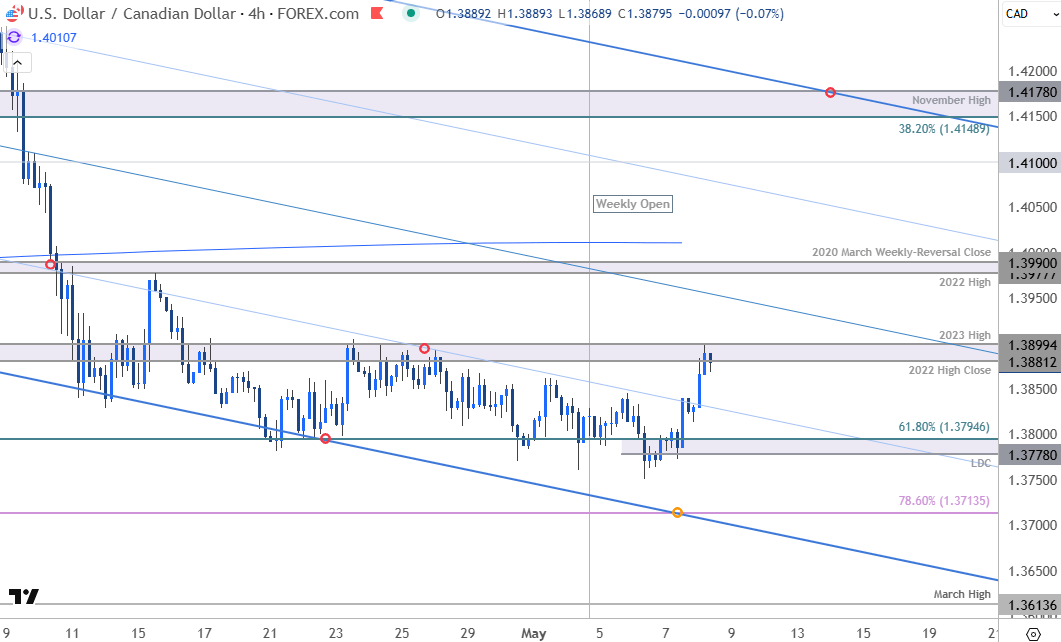
Chart Prepared by Michael Boutros, Sr. Technical Strategist; USD/CAD on TradingView
Notes: A closer look at Canadian Dollar price action shows USD/CAD rebounding off the lower parallel with a breakout of the weekly opening-range extending into pivotal resistance. Support now rests with the low-day close (LDC) / 61.8% retracement of the December 2023 advance / monthly open at 1.3778/98- a break / close below this threshold would be needed to mark downtrend resumption towards the 78.6% retracement of the September advance at 1.3714 and the March high at 1.3614.
A topside breach above this pivot zone exposes key resistance at 1.3977-1.4010- a region defined by the 2022 high, the 2020 March weekly reversal close and the 200-day moving average. A close above this region would be needed to suggest a more significant low was registered this week / a larger reversal is underway with subsequent objectives eyed at the 1.41-handle and 1.4149/78- look for a larger reaction there IF reached.

Bottom line: A rebound off downtrend support takes USD/CAD into the topside of a multi-week range – risk of a larger recovery while above the weekly open. From a trading standpoint, losses should be limited to 1.3778 IF price is heading higher on this stretch – look for a larger reaction on test of the 200-day moving average.
Keep in mind we get the release of Canadian employment tomorrow with key U.S. inflation data on tap next week (CPI). Stay nimble into the release and watch the weekly closes here for guidance. Review my latest Canadian Dollar Weekly Technical Forecast for a closer look at the longer-term USD/CAD trade levels.
Key USD/CAD Economic Data Releases
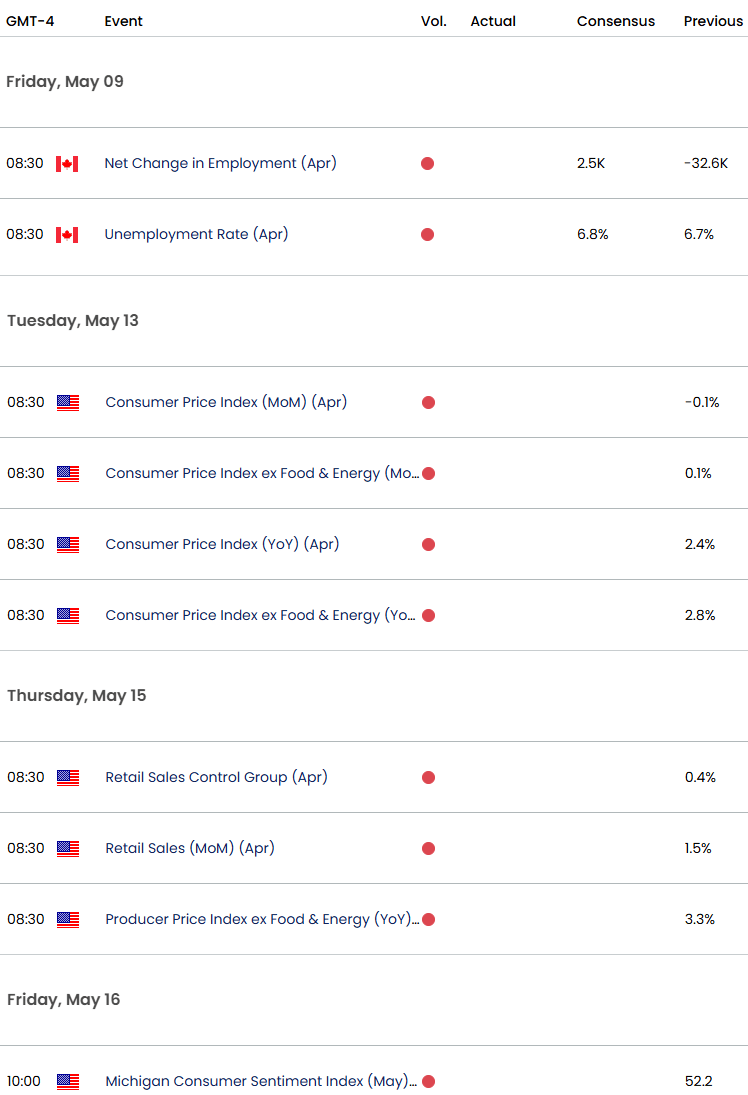
Economic Calendar - latest economic developments and upcoming event risk.
Active Short-term Technical Charts
- US Dollar Short-term Outlook: USD Bulls Steady After Fed Decision
- Euro Short-term Outlook: EUR/USD Poised for Breakout Ahead of Fed
- Swiss Franc Short-term Outlook: USD/CHF Coils Ahead of Fed
- Gold Short-term Outlook: XAU/USD Breaks Below Support, Bulls Poised
- Japanese Yen Short-term Outlook: USD/JPY Coils Ahead of BoJ, NFP
- British Pound Short-term Outlook: GBP/USD Bulls Eye 2024 High
- Australian Dollar Short-term Outlook: AUD/USD Halted at Resistance
Written by Michael Boutros, Sr Technical Strategist
Follow Michael on X @MBForex
Latest market news
September 18, 2025 02:48 PM
June 23, 2025 01:22 PM
June 23, 2025 10:39 AM
June 20, 2025 05:23 PM
June 20, 2025 04:46 PM
June 20, 2025 03:35 PM

June 18, 2025 07:38 PM

June 18, 2025 03:24 PM
June 16, 2025 03:30 PM

June 12, 2025 04:08 PM