

Following Trump’s announcement of new tariffs last night, the German DAX index staged a sharp decline as concerns were raised about European carmakers and their profitability. And although the markets staged a bit of a recovery after the US open today, and the DAX even managed to erase its earlier losses, it remains to be seen whether markets will stage a meaningful recovery even if a sense of calmness returned to the market. But it could be the calm before the storm. Indeed, safe haven gold has just hit a new record high as trade war uncertainty creates volatility in stock markets. The trade war has escalated and there is going to be a lot of back and forth from now until the April 2 “liberation day.” Against this backdrop, we will maintain a short-term bearish view on the European markets. The DAX outlook could weaken if we see further support levels break in the coming days, which could accelerate the selling pressure.
Car makers take a hit
The trade war has escalated, and an unsurprisingly, German carmakers are leading the declines or are among the biggest decliners today – we saw sharp drops in shares of Porsche, Mercedes, and other carmakers such as BMW and VW.

Technical DAX outlook: Key levels to watch on the daily
The DAX printed a bearish engulfing candle yesterday on the daily chart, breaking support at 22,856-22,715 area. This level was previously breakout zone from where the index rallied to test its prior all-time high, where it formed a potential double-top pattern. However, this double top pattern has not been confirmed yet since major support levels have not been broken. That could change if selling pressure continues.
For as long as the index now remains below the 22,856-22,715 (shaded grey) area, the path of least resistance will be to the downside, which would point to a bearish technical DAX outlook. If the DAX continues declining, it could break other key levels, such as 22,300, followed by 22,117, before potentially testing a critical trend line. Whether the index will fall all the way to the trend line remains to be seen, especially given the recent approval of a major stimulus package in Germany, which has driven the market higher in recent months. However, the market appears overstretched at these levels.
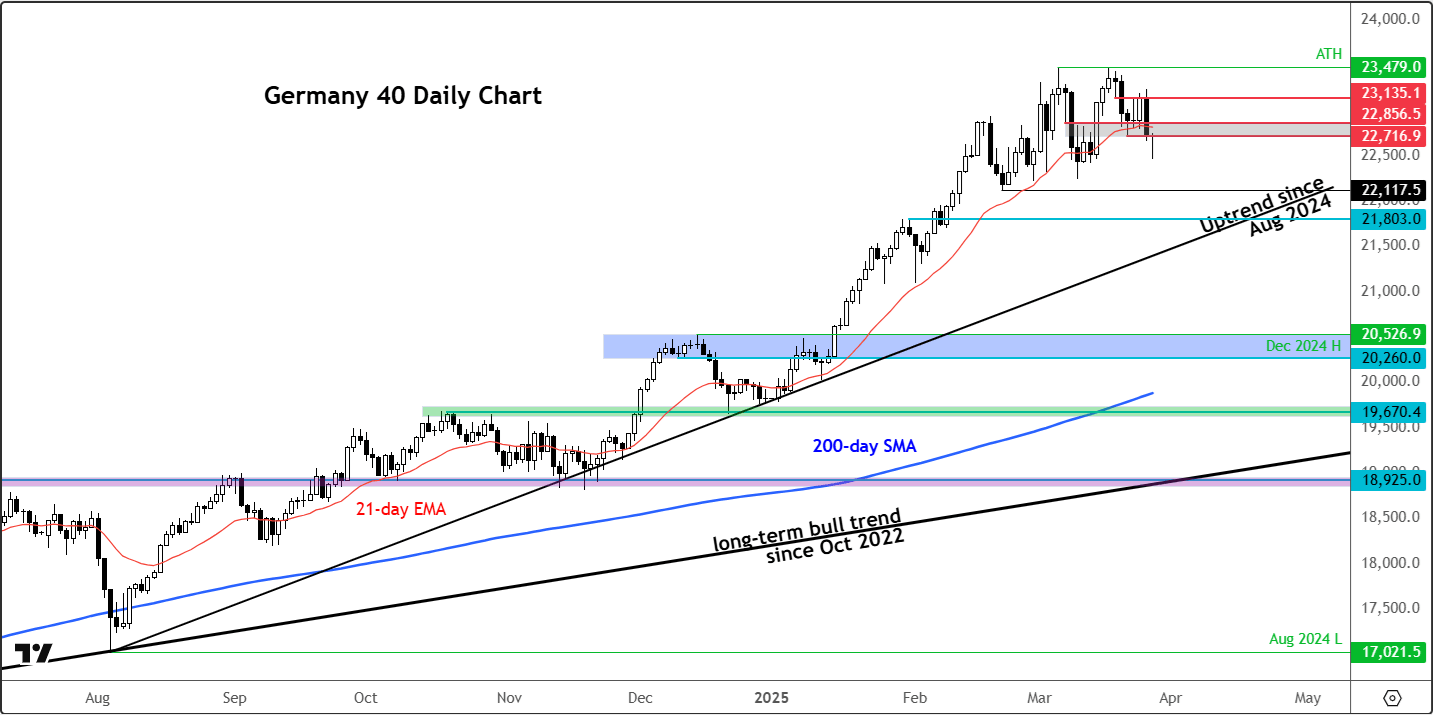
Now, some key support levels to watch include the area where the trend line from August of last year comes into play. As things stand, this is around 21,800, where the DAX previously encountered resistance before breaking higher. Below that, if the index falls under the bullish trend line, the next key support would be the December highs around 20,526—that would represent a massive drop from current levels. Whether the market reaches that point remains to be seen, but it is currently in extreme overbought conditions and will need to correct either through time or price action.
DAX long-term overbought conditions need to be monitored
Looking at the long-term charts, the DAX appears expensive. The weekly RSI (Relative Strength Index) has started coming down slightly due to recent consolidation, but it was previously at 80 on the weekly timeframe after a massive rally in the past few months. On the monthly chart, consecutive month-over-month gains have pushed the RSI to extreme overbought levels above 75.
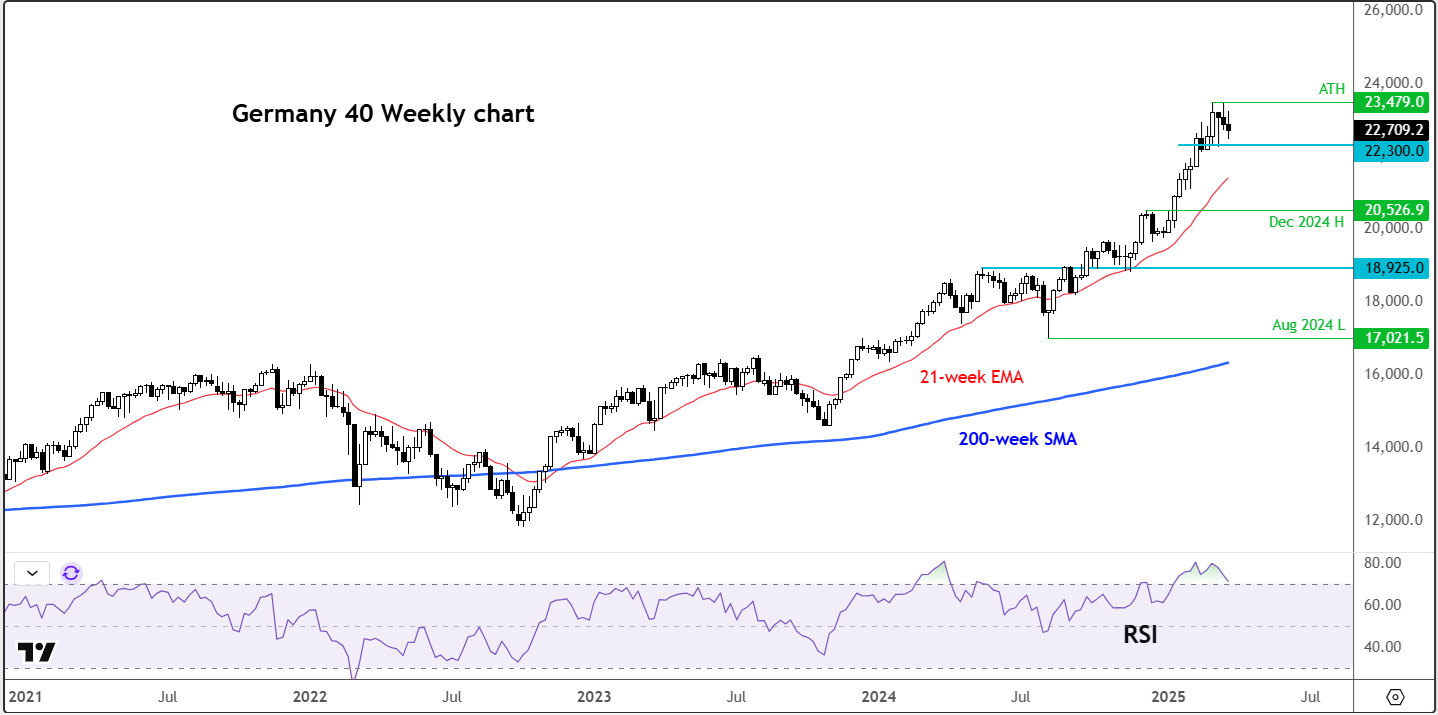
While the RSI on the long term charts has started to decline slightly, it remains above the overbought threshold of 70, meaning the market still needs to unwind. If the RSI unwinds through time—meaning consolidation—it would be a bullish scenario. However, if the market sells off sharply, it would lower RSI levels but be considered a bearish development.
Source for all charts used in this article: TradingView.com
-- Written by Fawad Razaqzada, Market Analyst
Follow Fawad on Twitter @Trader_F_R
Latest market news
June 13, 2025 06:22 PM
June 13, 2025 04:30 PM
June 13, 2025 04:18 PM
June 13, 2025 04:07 PM
June 13, 2025 02:43 PM

June 12, 2025 11:24 PM

June 12, 2025 11:00 AM

June 12, 2025 06:08 AM

June 11, 2025 03:31 PM