

Over the past five trading sessions, the Dow Jones index has posted a decline of more than 2%, currently hovering around 42,000 points. Selling pressure remains on the DJIA as markets fear the potential enforcement of tariffs announced by the White House. As long as this uncertainty persists, it’s likely that buying momentum will struggle to regain strength.

What’s next for tariffs?
Since the announcement of a 25% tariff on goods from Canada and Mexico, no concrete agreement has been reached with the U.S. administration. The tentative effective date remains set for April 2, and there have been no official signs of delay.
The most recent statement by the U.S. government has added further uncertainty: a general 20% tariff on most imported goods—regardless of country of origin—is under consideration. This would mark a shift in trade policy, moving away from targeted countries like Mexico, Canada, China, or the EU and expanding to a global scope. While more official information is expected in the coming days, these comments have already increased concerns about a global economic slowdown.
In this context, even the United States could be heavily impacted. According to the latest OECD report, U.S. GDP growth is expected to drop to 2.2% in 2025 and 1.6% in 2026, compared to 2.8% in 2024. For global GDP, the forecast is 3.1% for 2025 and 3.0% for 2026, confirming a broad deceleration trend.
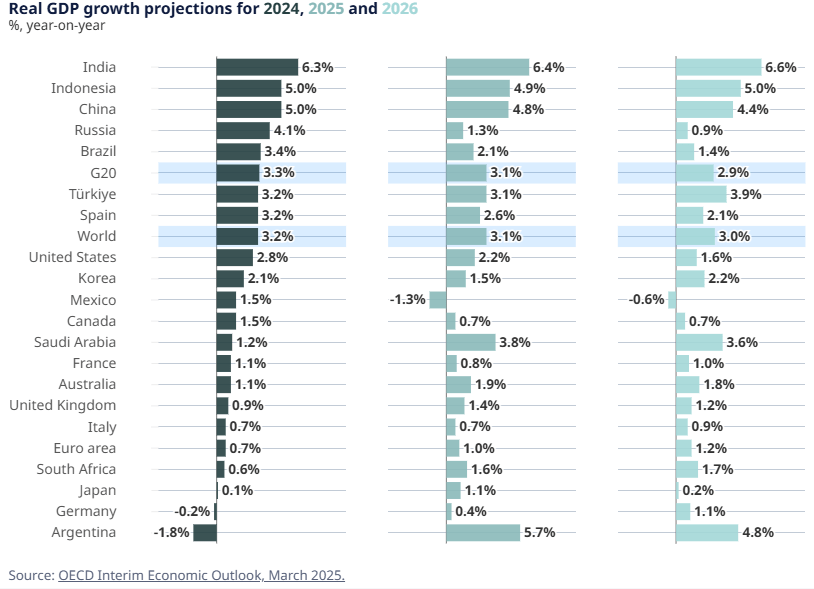
Source: OECD
As a result, the risk of a more aggressive trade war could affect the profitability of leading U.S. companies, due to higher production costs and potential declines in exports caused by retaliatory tariffs. This could continue to fuel the bearish bias that has characterized the index in recent weeks. If trade tensions escalate, the Dow Jones may face increased difficulty regaining the bullish momentum it showed at the beginning of 2025, as investors may choose to avoid risk assets amid an impending global economic slowdown.
What about the central bank?
Currently, the CME Group’s FedWatch tool shows an 83.5% probability that the U.S. interest rate will remain within the 4.25%–4.5% range at the upcoming May 7 decision.
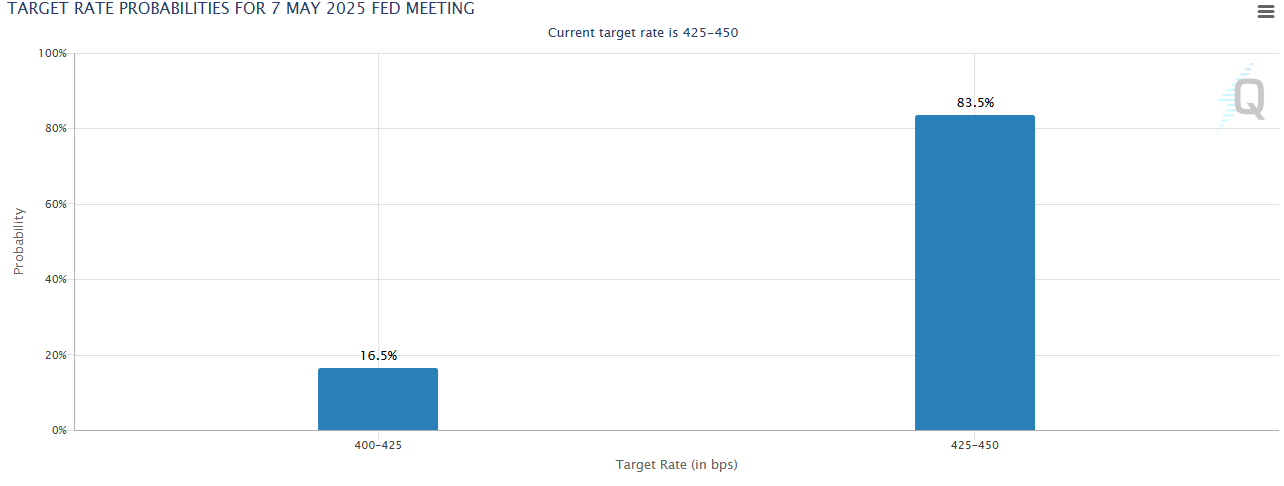
Source: CME Group
This outlook suggests that the market anticipates a neutral monetary stance, with stable rates over the next few weeks. However, if inflation does not decrease meaningfully, this policy could persist. In that case, the cost of borrowing for both businesses and consumers would remain high, potentially impacting domestic consumption and private investment. Over the long term, this could translate into weaker sales and lower financial returns for major corporations.
The Dow Jones, in turn, relies on lower interest rates to support domestic demand. If rates remain elevated, consumption barriers could keep downward pressure on the index in the coming weeks. The outlook could change if Federal Reserve Chairman Jerome Powell signals a shift toward rate cuts, which could help restore market confidence and provide relief to buying positions that have remained sidelined.
Technical Outlook for the Dow Jones
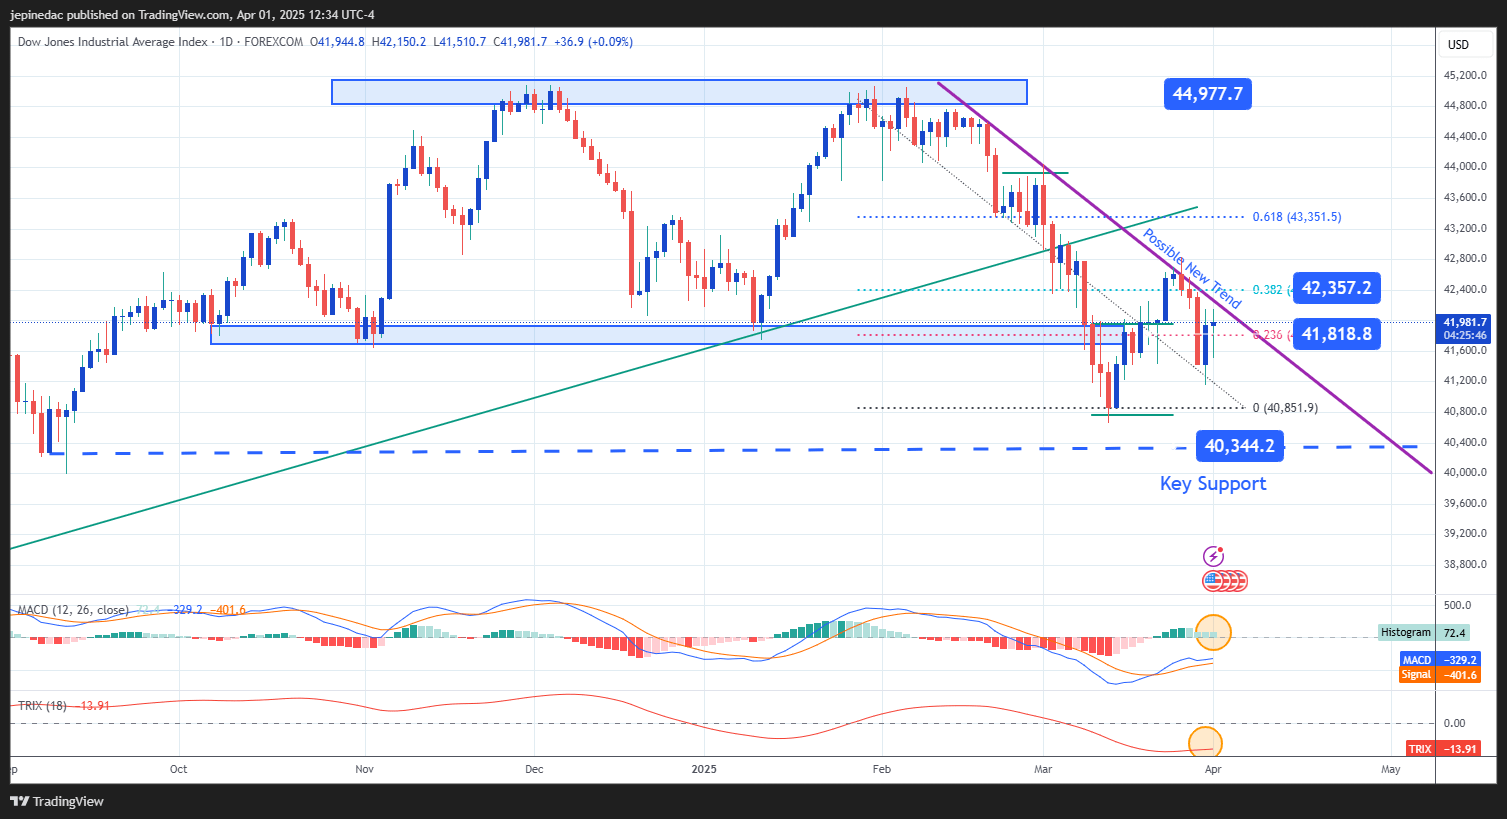
Source: StoneX, Tradingview
- Possible New Trend: Since early February, the chart has begun to trace a new downward trendline, bringing the index close to the 40,000-point level. So far, recovery attempts have failed to break this structure, and the overall bias remains clearly bearish.
- MACD: The MACD remains slightly above the zero line, but the histogram has started to show declining values, suggesting that bullish momentum is weakening. If this trend continues, it may pave the way for a renewed selling phase.
- TRIX: Meanwhile, the TRIX indicator continues to oscillate below its neutral line, confirming that the average of moving averages over recent periods remains predominantly bearish. If this negative slope deepens, selling pressure could intensify further in the short term.
Key Levels:
- 42,300 points – Key resistance: This level aligns with the 38.2% Fibonacci retracement. A breakout above this level could challenge the current downtrend and trigger a technical recovery.
- 41,800 points – Near support: This level marks recent lows and corresponds to the 23.6% Fibonacci retracement. A break below it could reactivate downside pressure.
- 40,300 points – Critical support: This area reflects a neutral technical zone not seen since September 2024. A breakdown here could confirm a broader bearish trend with potential long-term implications.
- 42,300 points – Key resistance: This level aligns with the 38.2% Fibonacci retracement. A breakout above this level could challenge the current downtrend and trigger a technical recovery.
Written by Julian Pineda, CFA – Market Analyst
Latest market news

April 14, 2025 03:50 PM

April 9, 2025 11:43 AM

March 27, 2025 09:25 AM

March 26, 2025 10:26 PM