

Key Events
- EURUSD and Gold Drop 200 Points on Trade Deal Hopes
- Eurozone PMIs fell below expansion levels, though EURUSD held above 1.14
- Risk-on appetite slightly returned Tuesday as Trump softened his stance on China, fueling hopes for a potential trade agreement
- Trump also clarified he has no plans to remove Fed Chair Powell, relieving some pressure on the DXY—although global tariff risks and market uncertainties persist despite this temporary optimism
Following a long Easter holiday, markets reopened under a cloud of pessimism regarding U.S. monetary policy independence, driven by Trump’s repeated attacks on the Fed. The DXY slid toward 98 amid unresolved U.S.-China trade tensions.
As pessimism deepened, Gold spiked to the 3500-mark. However, Trump’s clarifying remarks became a key catalyst, prompting a sharp reversal: Gold dropped from 3500 to 3300, while EURUSD slid from 1.15 down to 1.13.

That said, the sustainability of these reversals remains uncertain. Tariff disputes and lingering questions around the finalization of trade deals with China continue to cloud the global outlook.
Today’s flash Manufacturing and Services PMI data reflected a deterioration in Eurozone sentiment, with readings falling below expectations and deepening into contractionary territory. Still, EURUSD bounced from the 1.13 support zone, currently trading back around 1.14—indicating a tentative bullish reversal.

Technical Analysis:
EURUSD Monthly Time Frame – Log Scale
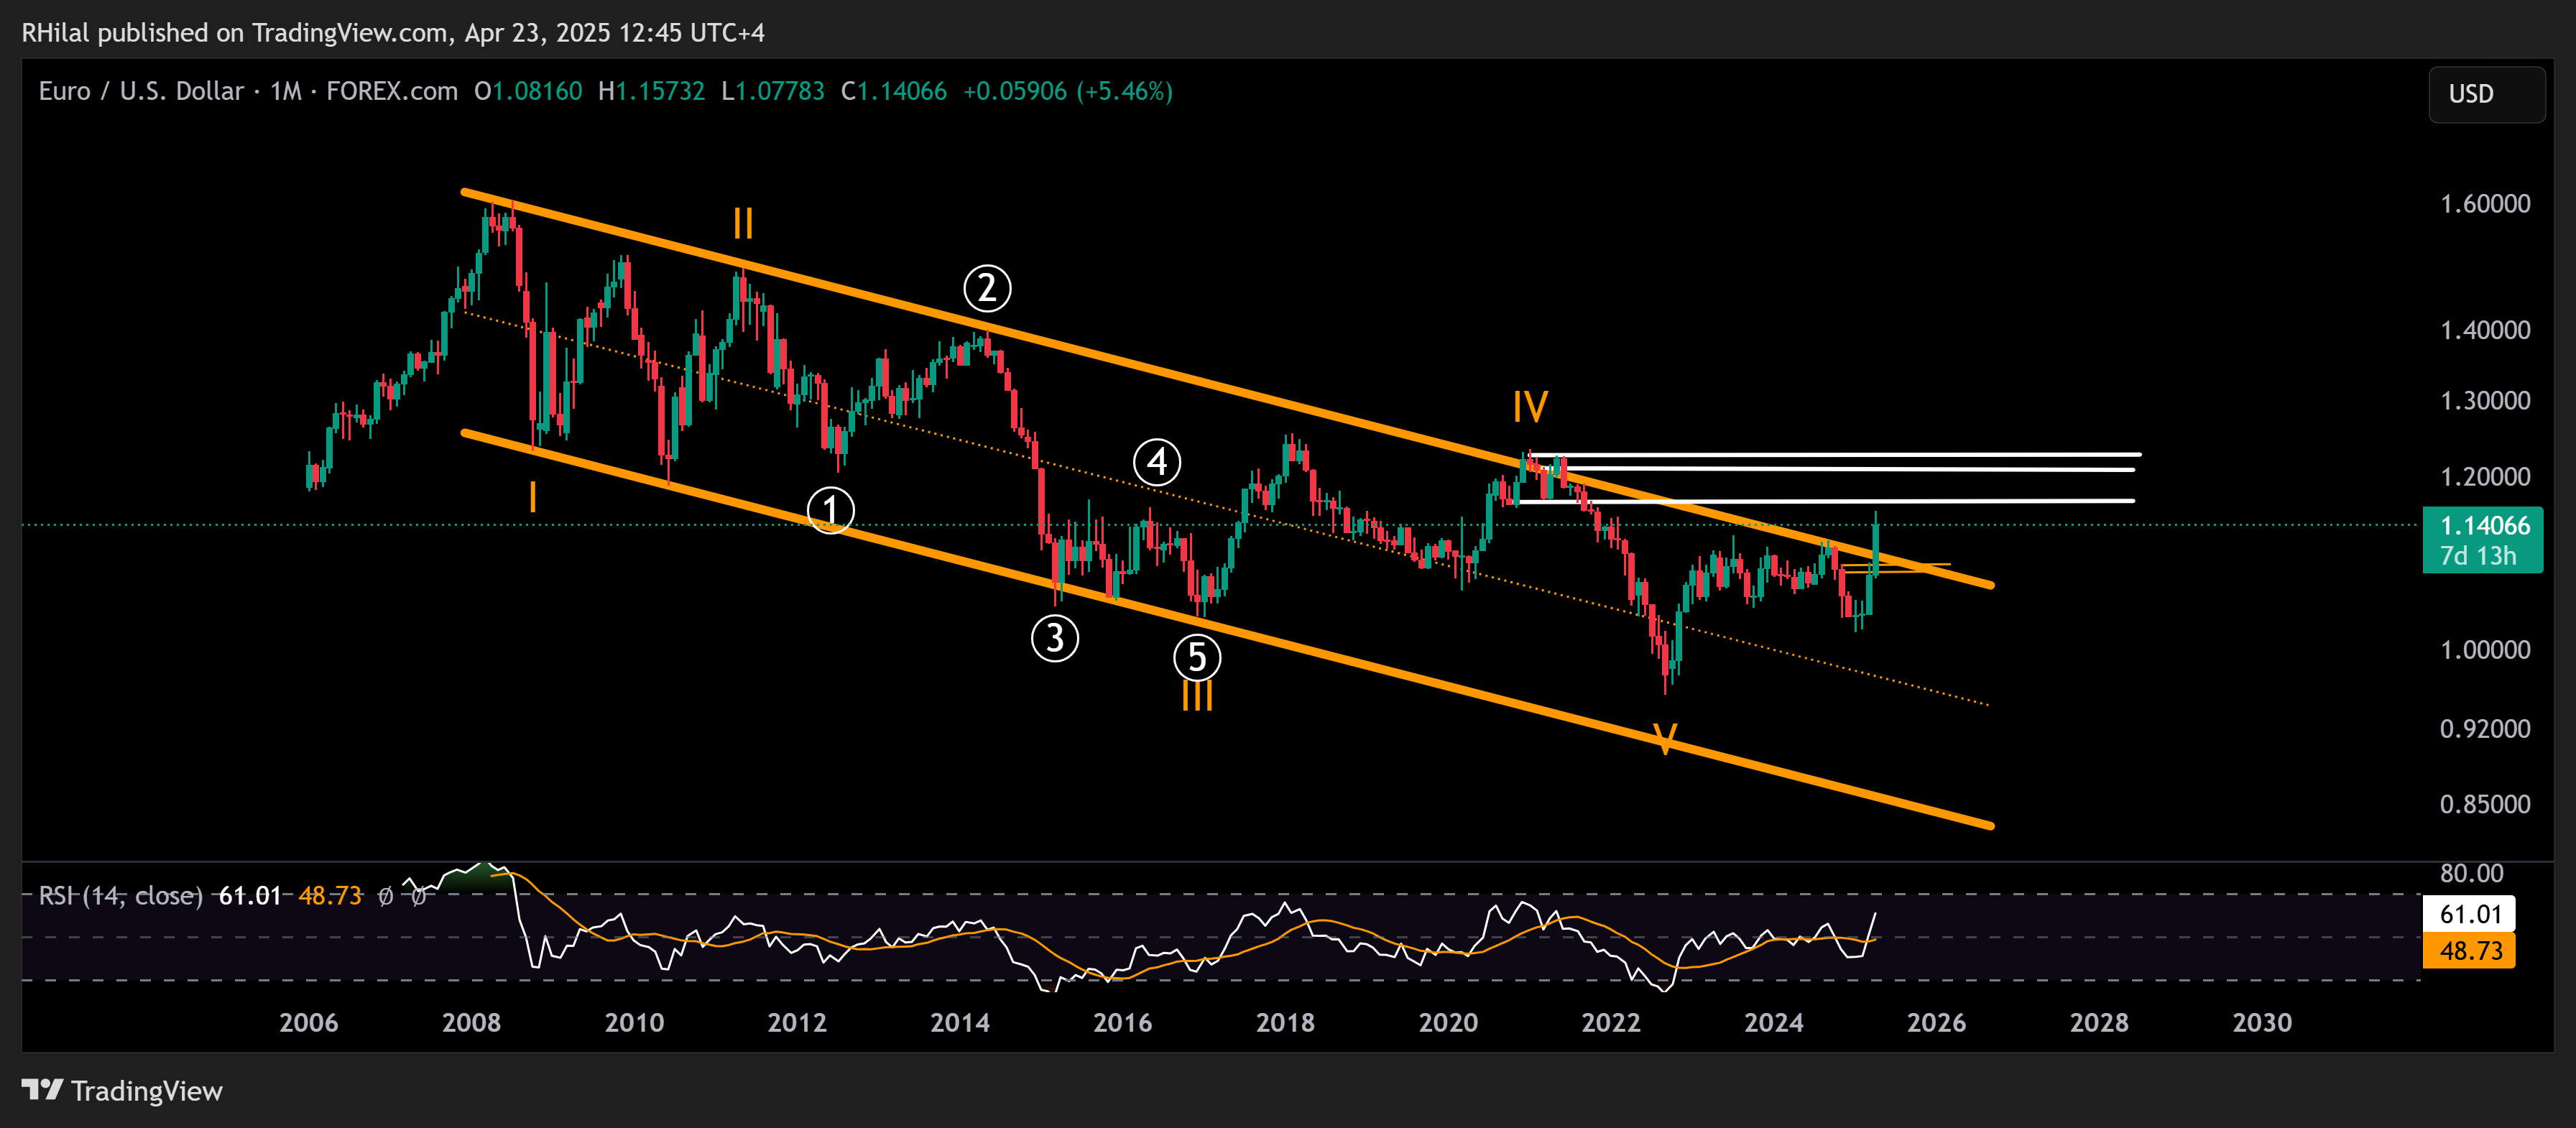
Source: Tradingview
The EURUSD pair continues to trade above the upper boundary of the long-term descending channel dating back to the 2008 highs. While the long-term outlook remains bullish, short-term corrections may be necessary to cool off overbought momentum seen on the daily and weekly charts.
A break above 1.16 could signal an upward trajectory toward the 2021 highs, with resistance levels around 1.17, 1.2080, and 1.2280.
On the downside, support could align with the channel’s upper boundary as highlighted in the chart below
EURUSD Weekly Time Frame – Log Scale
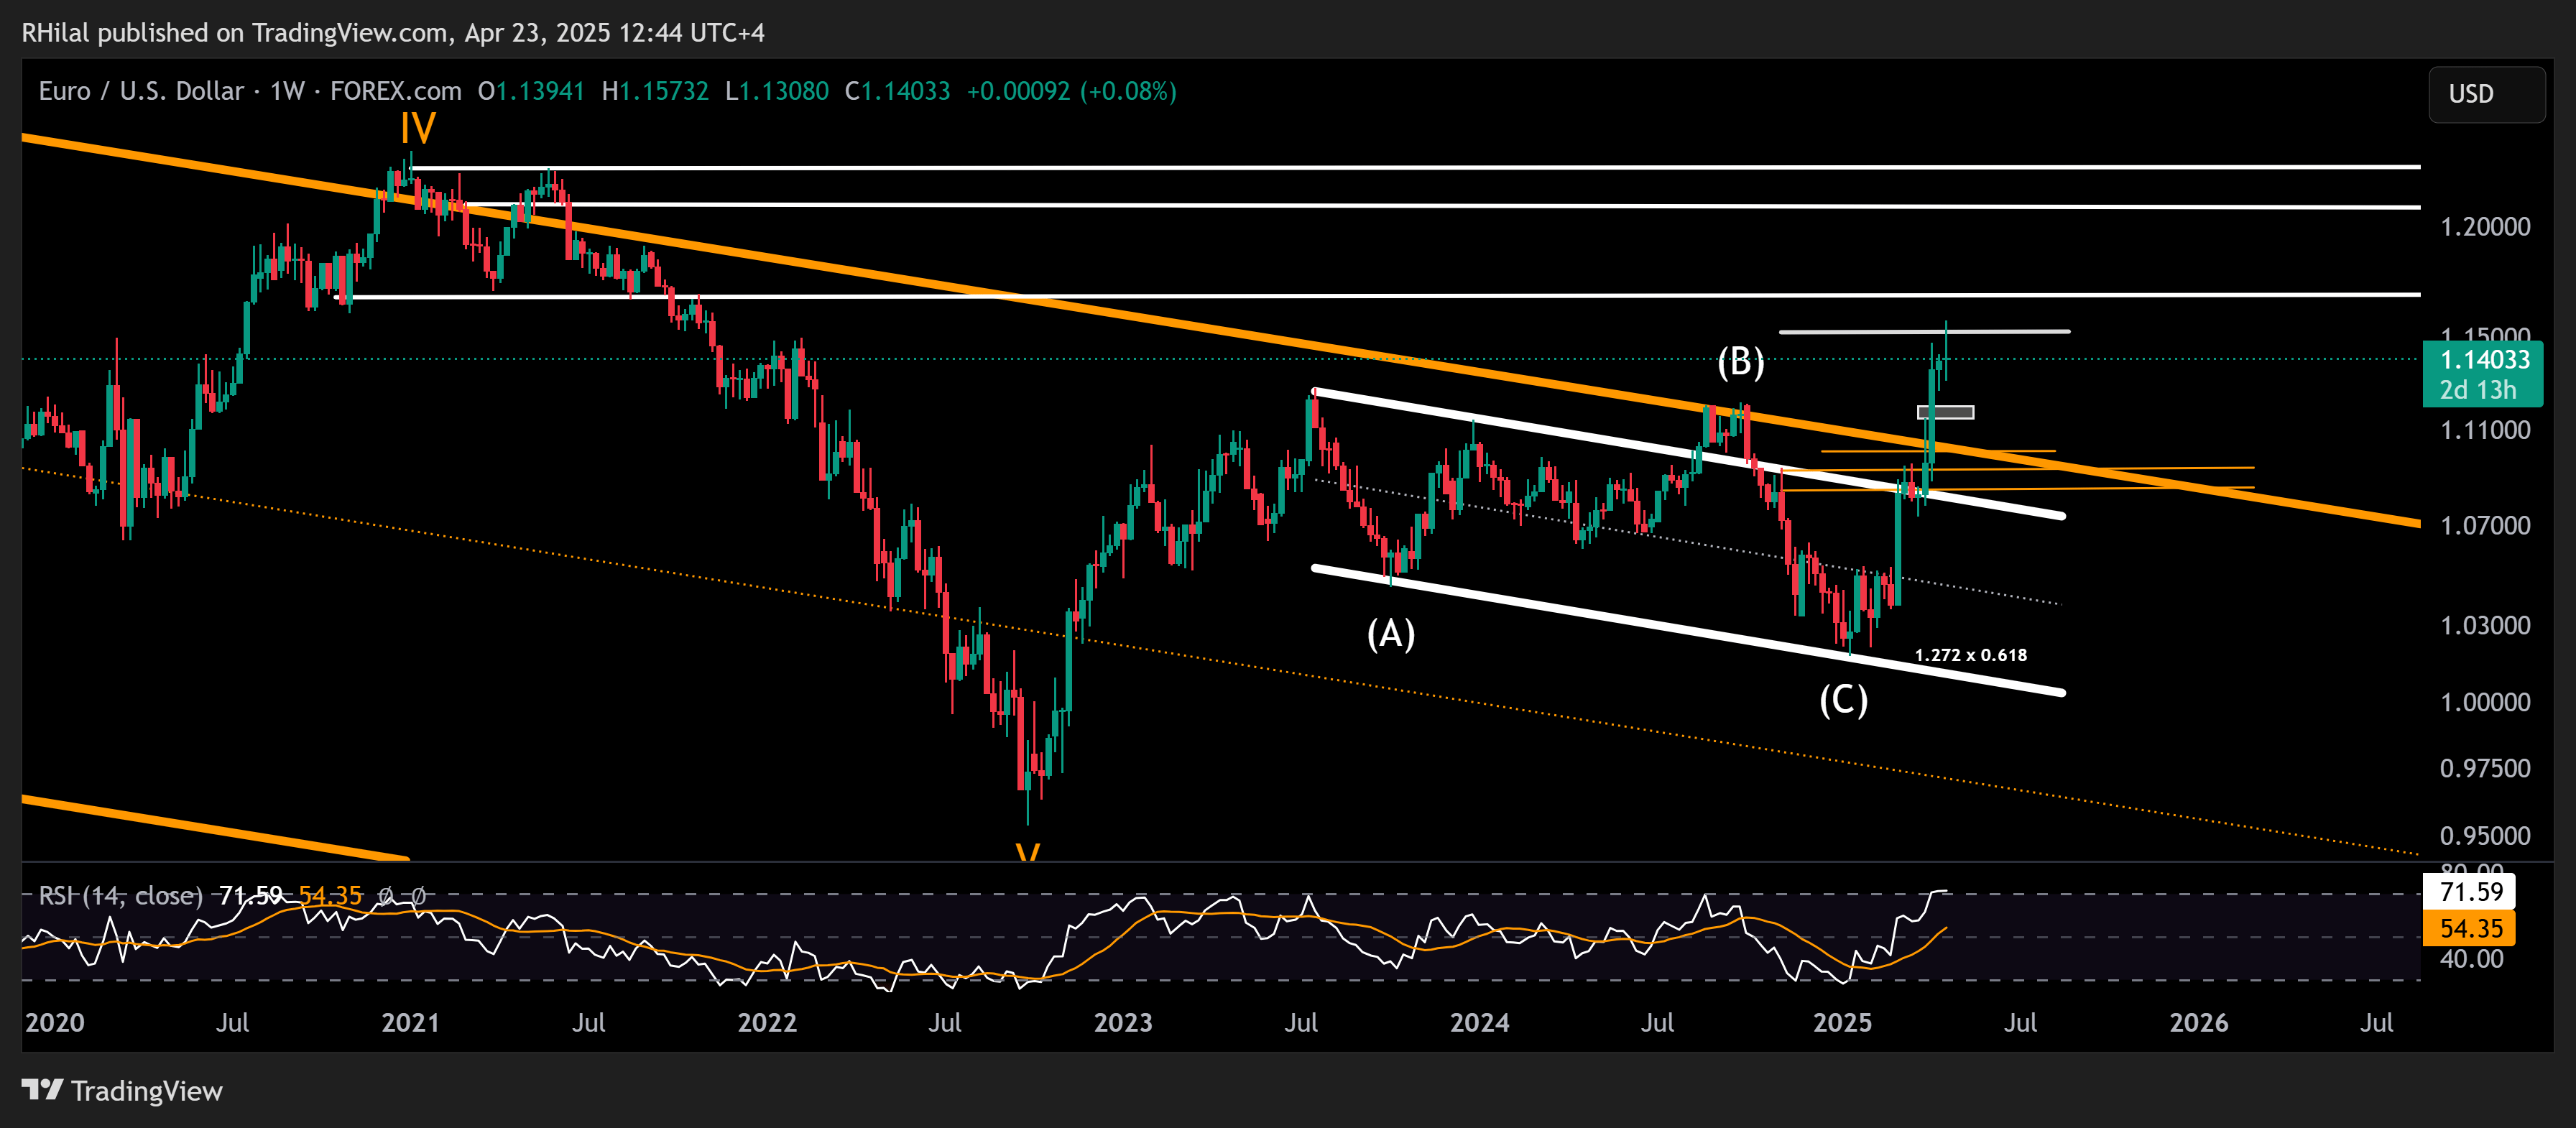
Source: Tradingview
From the downside, if the pair breaks below 1.13, support levels are expected at 1.12, 1.1140, 1.10, 1.0920, and—in more extreme scenarios—1.07, all of which align with the upper boundary of the descending channels.
Gold Monthly Time Frame-Log Scale
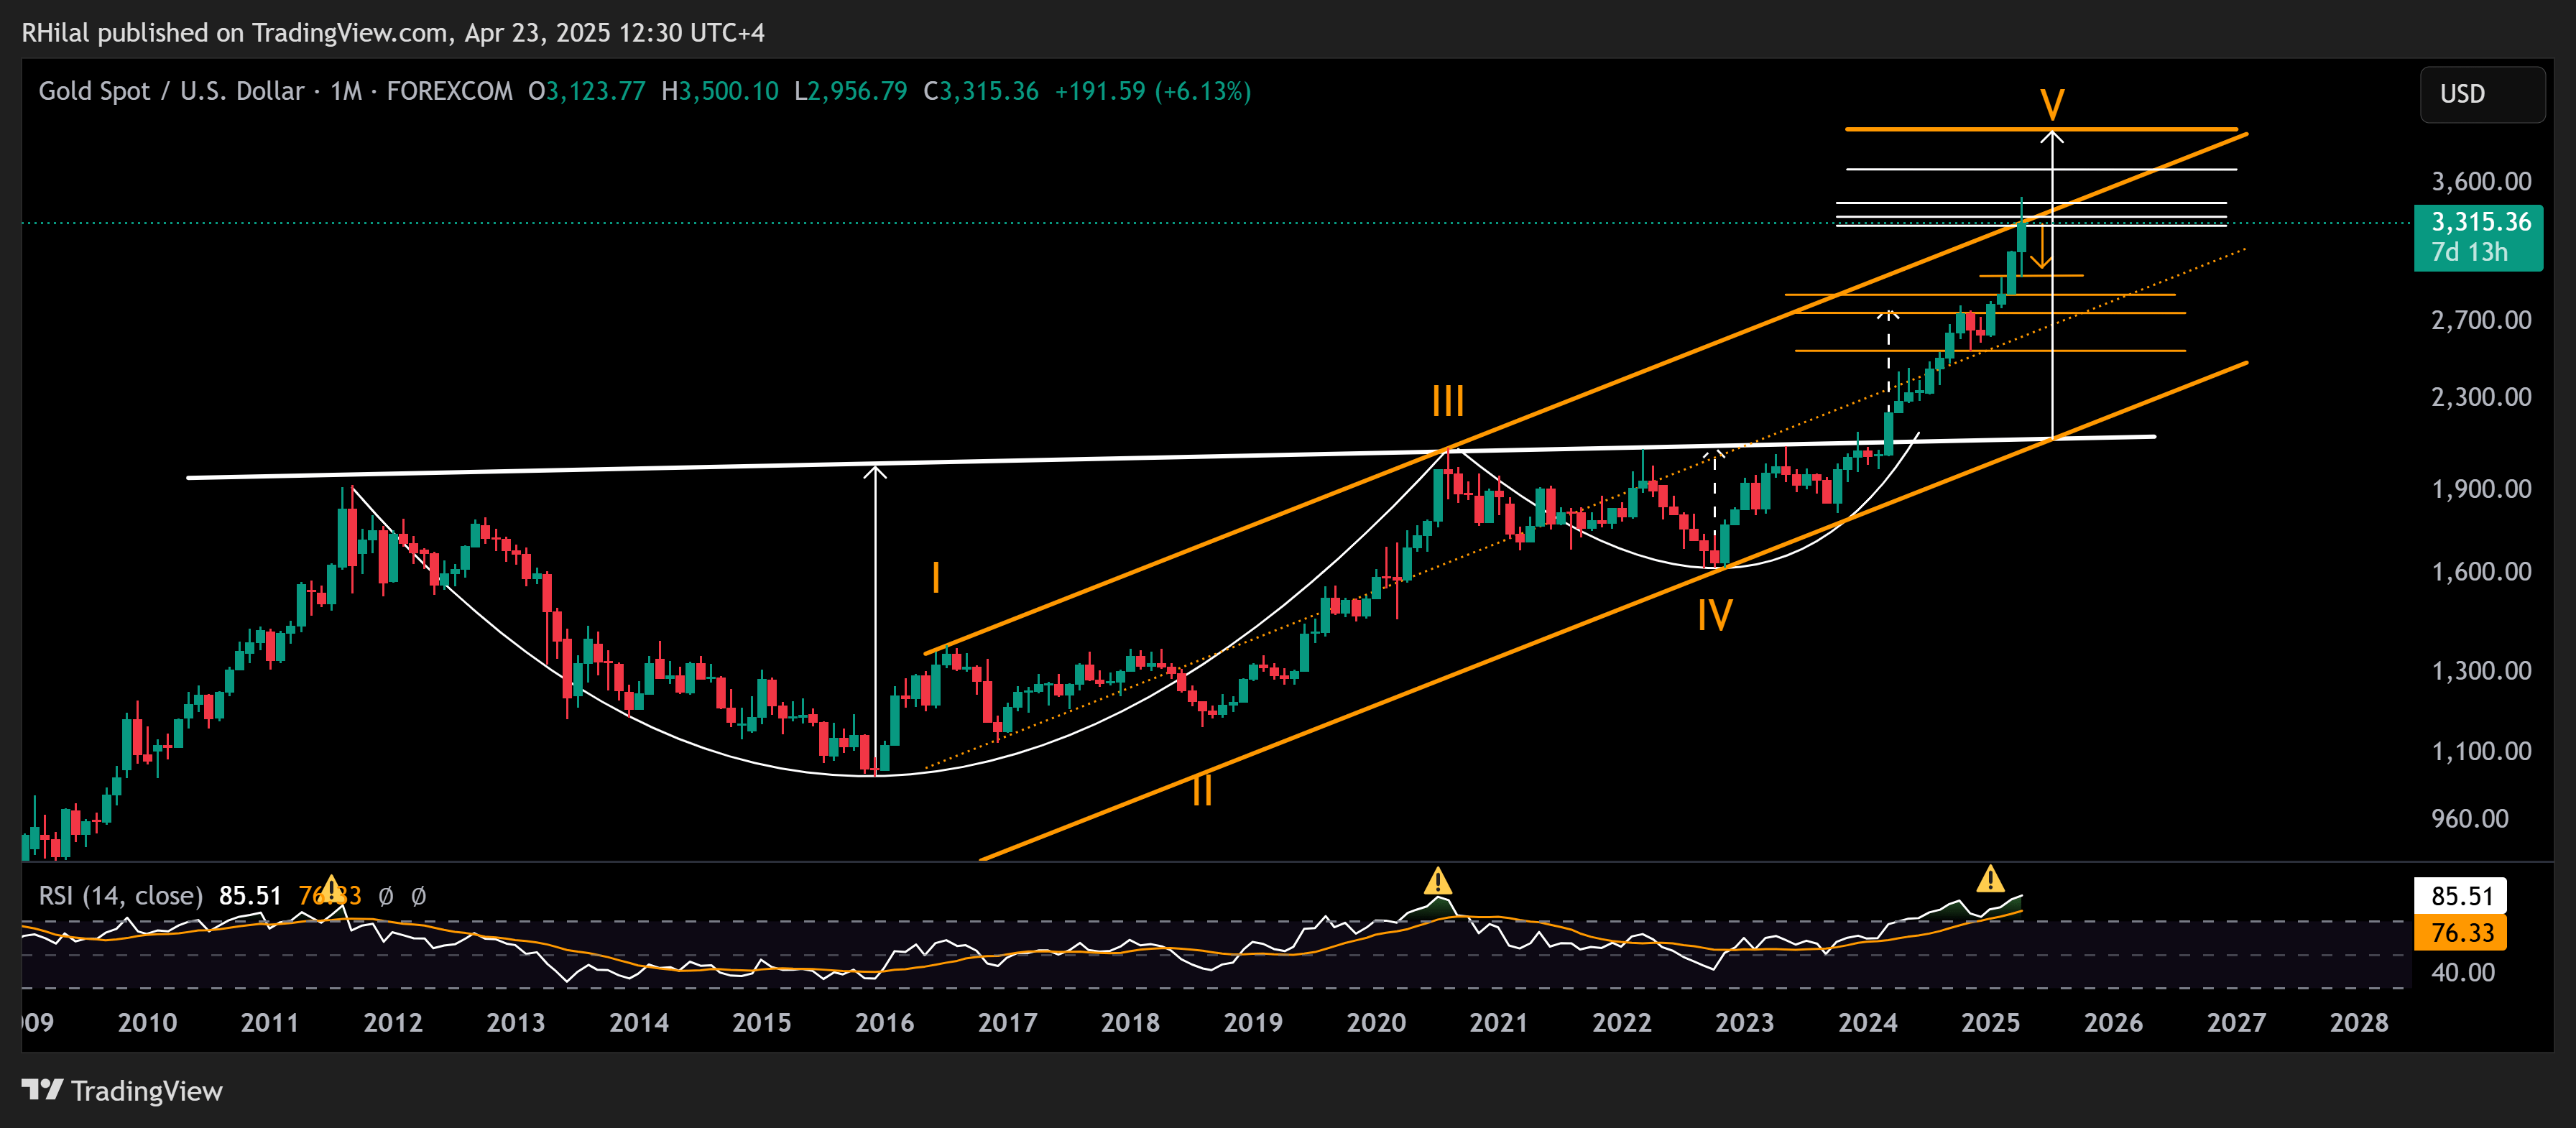
Source: Tradingview
From a monthly perspective, Gold’s broader trajectory appears to align with a classic cup and handle formation, targeting the $3,700 and $4,000 per ounce levels—supported by a clear hold above $3,500. However, given the steep momentum currently in play, significant headwinds are likely as the market consolidates.
These may serve to recharge monthly momentum that currently aligns with 2020 and 2008 highs before the broader uptrend resumes.
Gold 4 Hour Time Frame - Log Scale
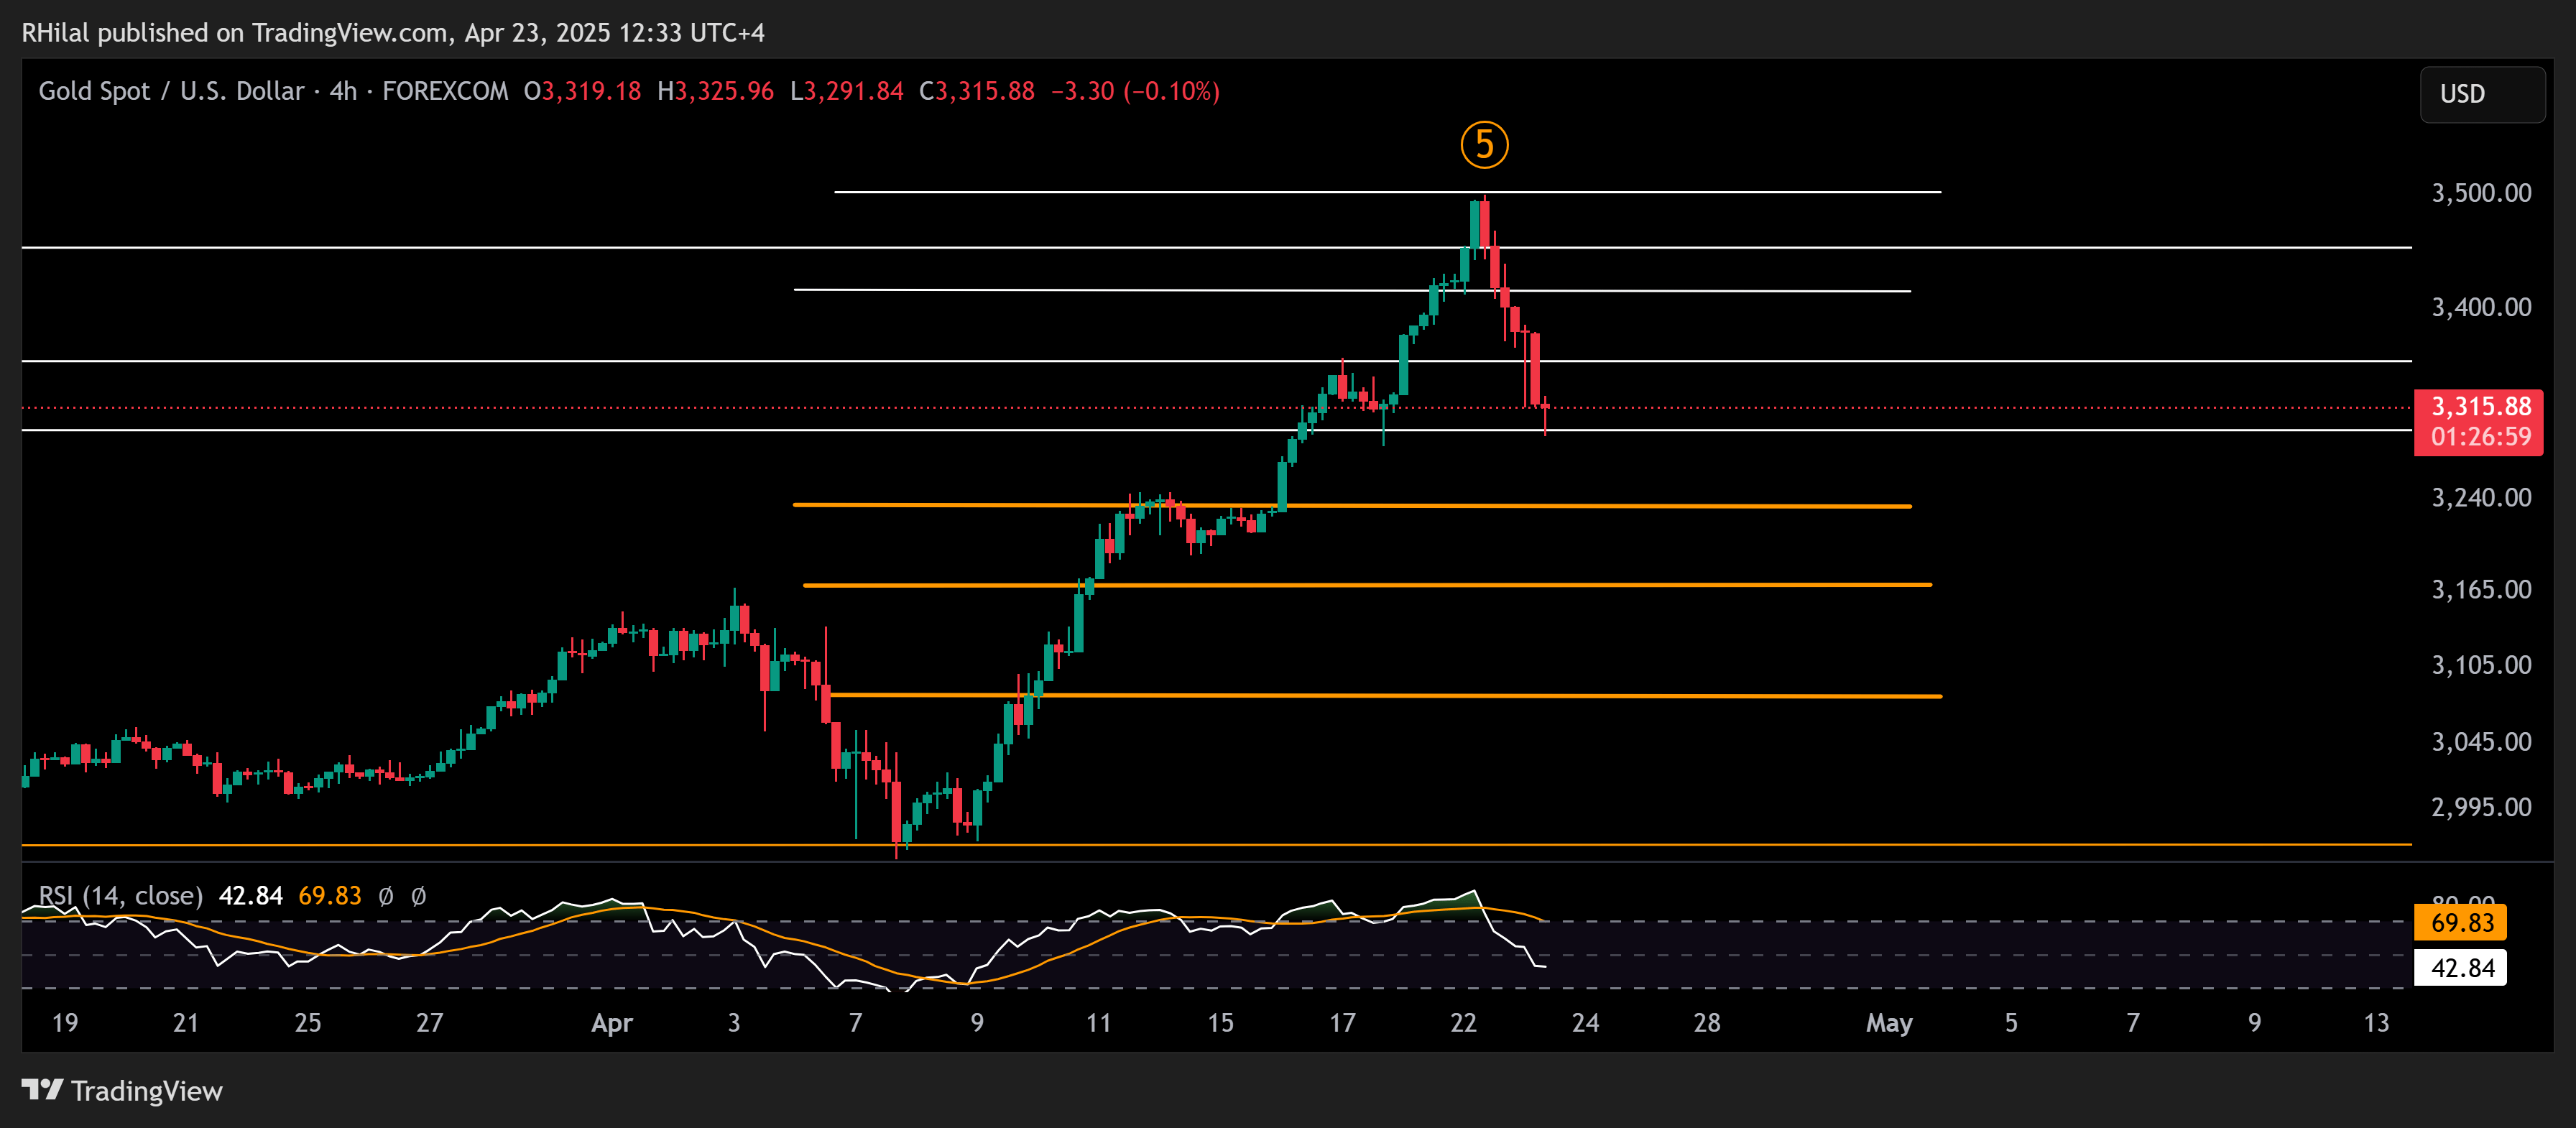
Source: Tradingview
On the 4-hour chart, downside levels are more clearly defined, with potential support below 2390 around 2320, 3170, 3080, and 2960—and, in more extreme conditions, 2800. Given the prevailing safe-haven demand, market uncertainty, and heightened speculation, these levels should be approached incrementally to manage risk and confirm the re-emergence of risk-on sentiment.
Written by Razan Hilal, CMT
Follow on X: @Rh_waves
Latest market news
Yesterday 06:00 PM
Yesterday 04:20 PM
Yesterday 04:18 PM
Yesterday 03:15 PM
Yesterday 11:45 AM

Yesterday 04:18 PM

April 23, 2025 08:29 AM

April 21, 2025 08:55 AM

April 17, 2025 02:45 PM