

EUR/USD Talking Points:
- I looked into the two trends in EUR/USD and so far, the broader bullish trend has prevailed following last week’s test of support at the 200-day moving average.
- EUR/USD has already come close to a test of the vaulted 1.1200 level that stopped bulls in their tracks last year, but for now the question is whether buyers can hold support at higher-lows, with both 1.1000 and 1.0943 in the picture.

EUR/USD had a very strong start to March and April is showing out in a similar way. The pair has put in a sizable breakout on the back of President Trump’s tariff announcement yesterday afternoon, and already the U.S. Dollar is nearing the same support that was in-play last Q3, just before the USD reversal took over.
Correspondingly, EUR/USD was trading around 1.1200 at the time and that level proved to be a brick wall of resistance. Buyers failed to breakthrough that price on two separate occasions, and then sellers took over and drove a reversal of more than 1,000 pips over the next few months.
But 2025 has so far turned out to be a change of pace. Dojis on the monthly chart of EUR/USD for both January and February led to a bullish reversal in March, and price is making a fast run at the same 1.1200 level despite the widespread expectation that more cuts are coming from the ECB.
EUR/USD Monthly Chart
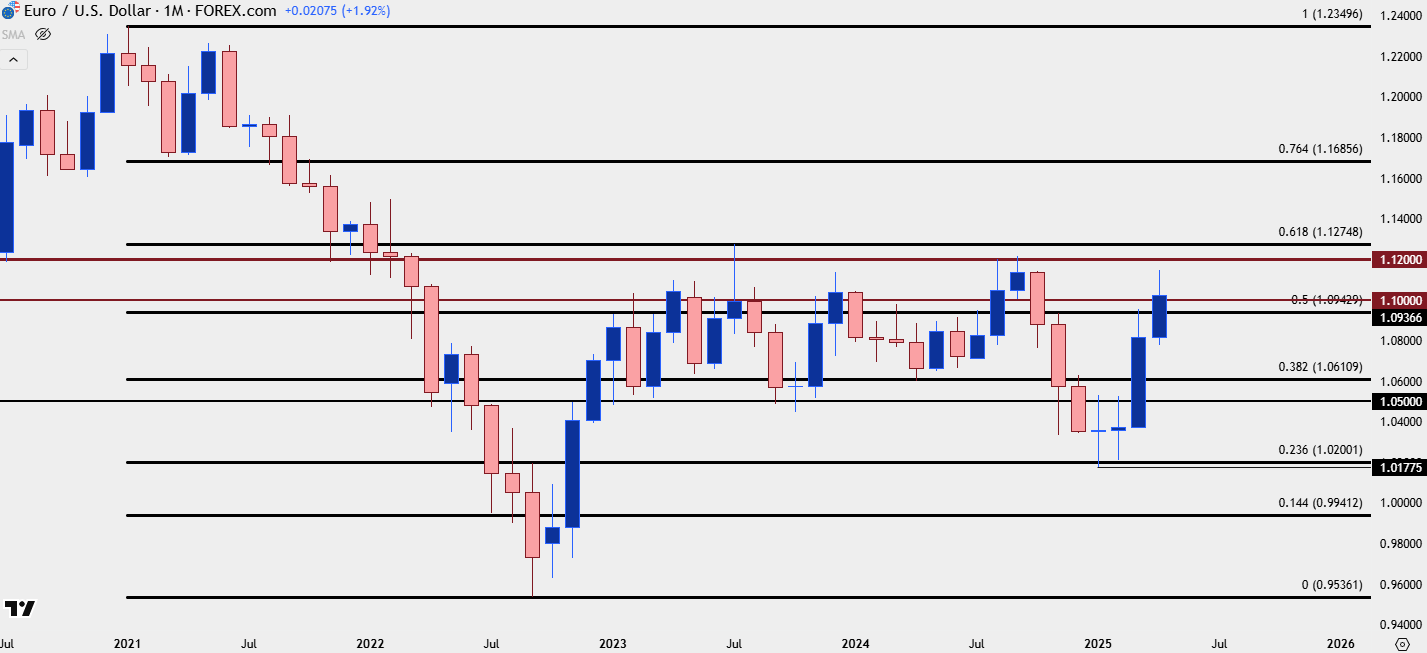 Chart prepared by James Stanley; data derived from Tradingview
From the weekly chart we can get some important context on the matter and it was the 1.0943 level that came in to hold the highs for Q2. Despite bulls having a full head of steam in the March breakout, that level completely stalled buyers in their tracks on two separate occasions. This is the 50% mark of a Fibonacci retracement that’s had quite a bit of interest over the past couple years, helping to carve out the high in 2023 at the 61.8% marker, and, so far, the low this year at the 23.6% retracement. The 50 mark at 1.0943 was resistance in the first half of this year and it held the highs twice in March, including into the FOMC rate decision.
At that point, I started to look for a turn in EUR/USD and the U.S. Dollar, helped along by RSI divergence in each market; and EUR/USD pulled back all the way to the 200-day moving average which ultimately ended up holding as support.
EUR/USD Weekly Chart
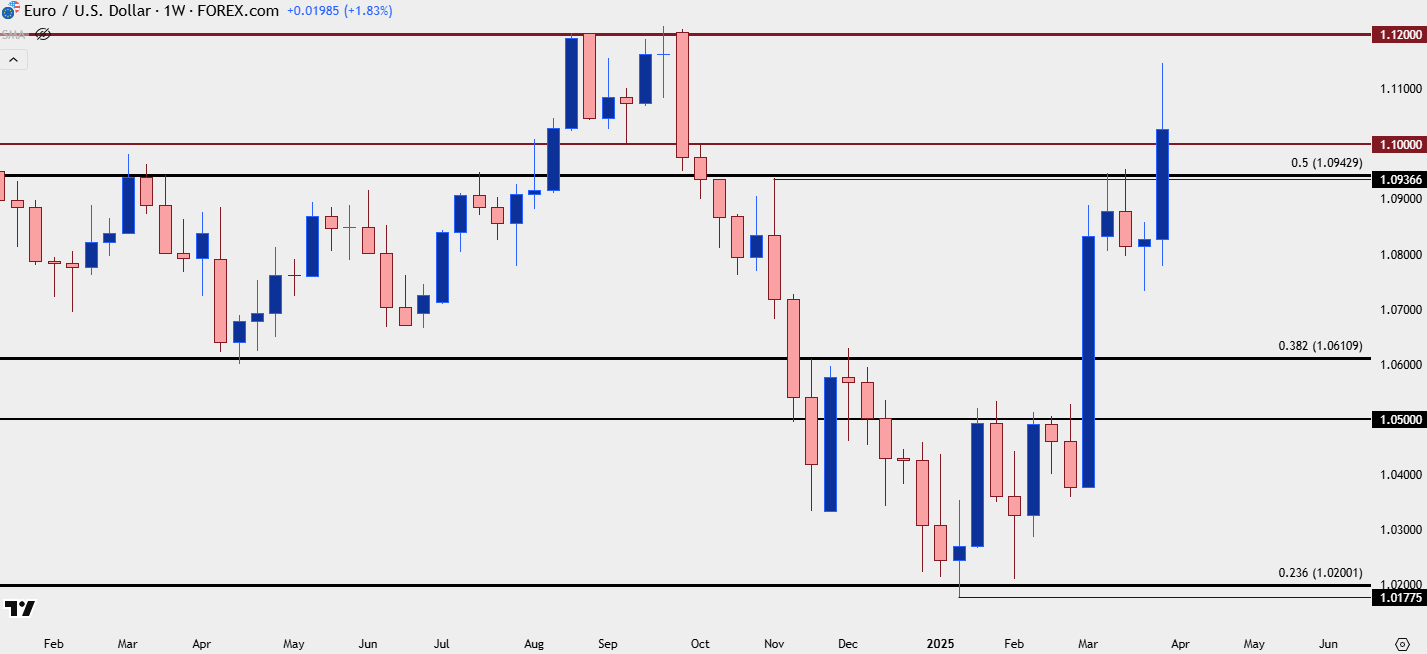 Chart prepared by James Stanley; data derived from Tradingview
EUR/USD into NFP
At this point bulls remain in control of the pair but the bigger question is how they respond on tests of support. Given the prior resistance at 1.0943, there’s an obvious level to watch for that; but also of interest is the 1.1000 level that buyers just jammed through in the recent breakout. That, too, represents higher-low support potential as we move into NFP tomorrow.
On the resistance side of the coin, the 1.1200 level still loom large and above that, 1.1275, which was the 2023 high and the 61.8% retracement from that same Fibonacci retracement.
EUR/USD Daily Chart
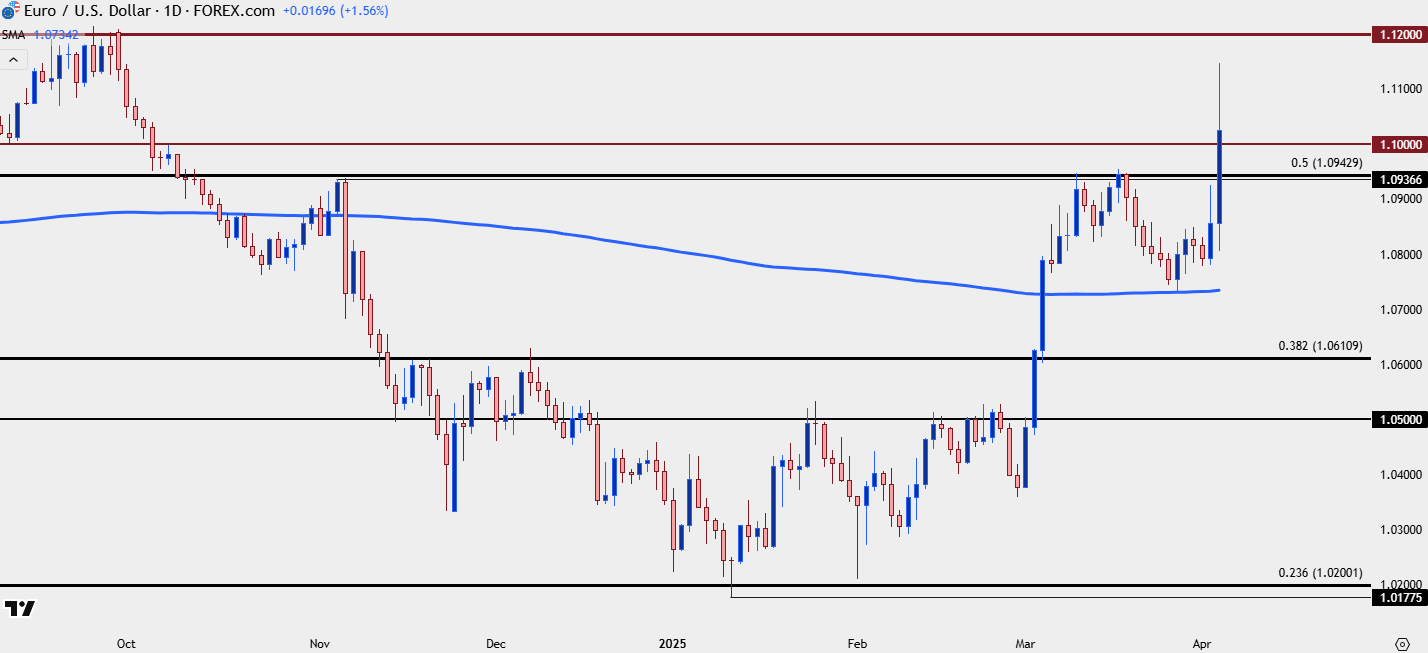 Chart prepared by James Stanley; data derived from Tradingview
--- written by James Stanley, Senior Strategist
Latest market news
September 18, 2025 02:48 PM
June 23, 2025 01:22 PM
June 23, 2025 10:39 AM
June 20, 2025 05:23 PM
June 20, 2025 04:46 PM
June 20, 2025 03:35 PM

June 20, 2025 05:23 PM

June 20, 2025 12:21 PM

June 20, 2025 05:20 AM

June 20, 2025 12:39 AM