

EUR/USD Talking Points:
- EUR/USD was super-charged just a month ago as the pair put in its first test over the 1.1500 handle in more than three years.
- EUR/USD started this week with a break of the shorter-term descending triangle formation, and the pair is now working on its fourth consecutive weekly loss after the shooting star that printed in late-April.
- I’ll be looking at EUR/USD in-depth during the weekly webinar: Click here to register.

It’s been a turn-around in EUR/USD, after the pair surged in early-April even as the European Central Bank was cutting rates, with the possibility of more softening to come down-the-road. And that followed one of the most intense breakouts that’s even been seen in the pair in early-March, which was a combination of both USD breaking down and shorts in EUR/USD being squeezed.
Since then, we’ve witnessed a textbook turn taking place as the pair tried – and failed – to break above the 1.1500 level around the Easter holiday in late-April. That weekly bar finished as a shooting star formation, and that was the first red weekly bar since before the pair had confirmed support at the 200-day moving average a month earlier.
The pair then followed with two more red weekly bars, including last week’s break of the descending triangle formation around the FOMC rate decision. And this week, so far, has started with more, as EUR/USD is now pushing its fourth consecutive weekly loss after giving up the 1.1200 handle and dropping down to next support at 1.1100.
EUR/USD Weekly Price Chart
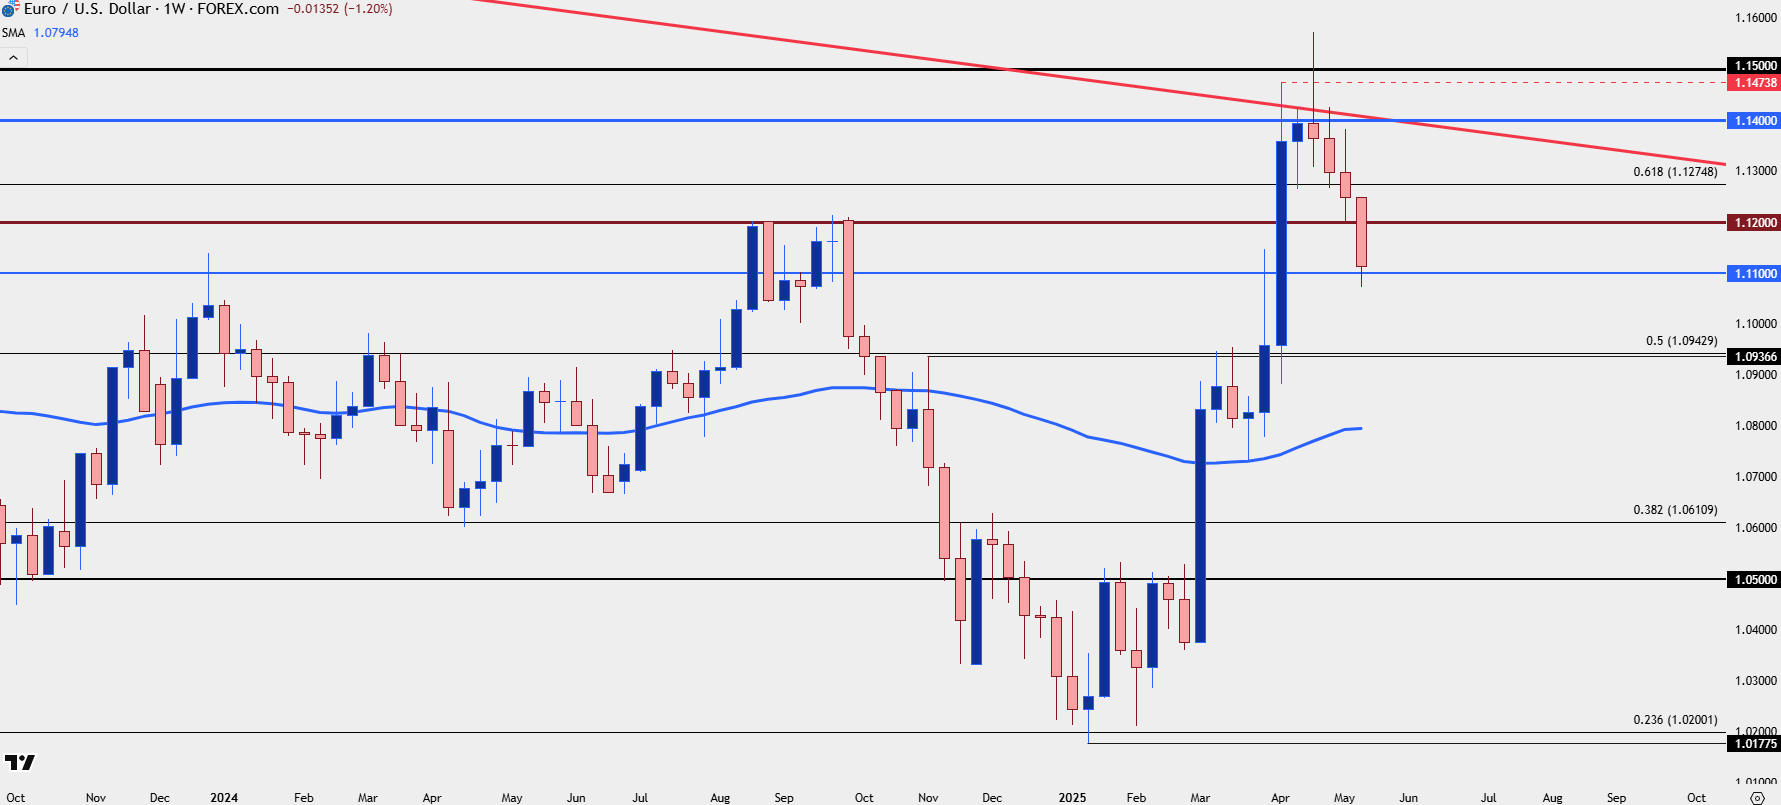 Chart prepared by James Stanley; data derived from Tradingview
EUR/USD Daily
The daily chart shows a build of lower-lows and highs that I had spoken of in last week’s webinar. That development has remained clean along key support and resistance levels, with early trade last week showing support at the 1.1275 Fibonacci level, followed by a bounce to a lower-high that retained the descending triangle. The breakdown from that move into a fresh lower-low pushed right to 1.1200, which then brought a bounce to a lower-high at prior support of 1.1275.
This week then sees price push down to another lower-low at the 1.1100 level that, so far, has held the lows.
EUR/USD Daily Chart
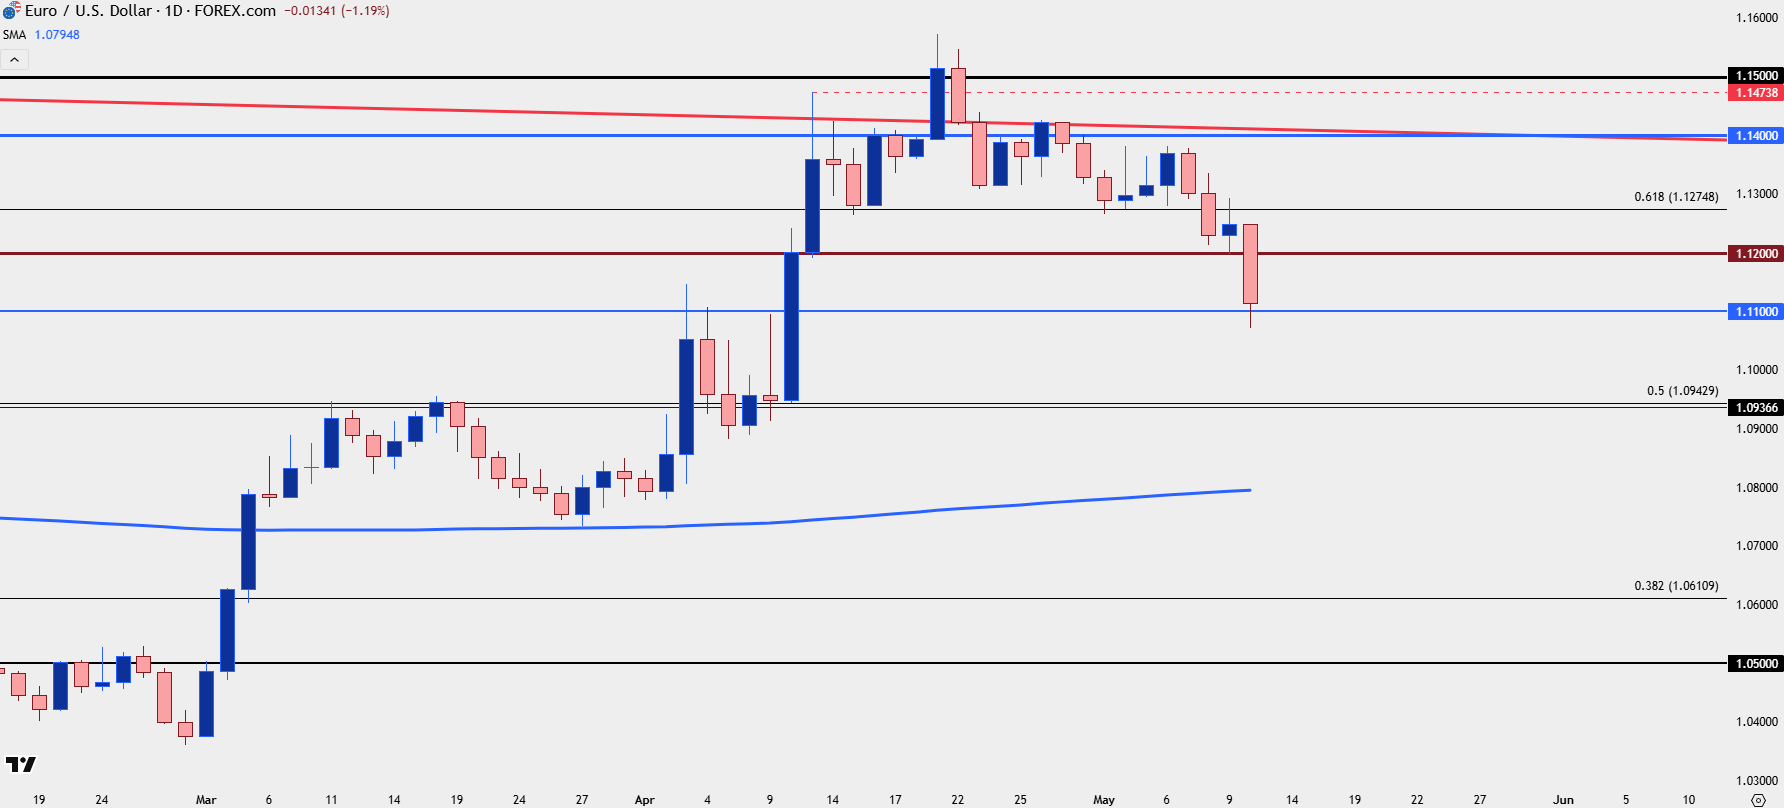 Chart prepared by James Stanley; data derived from Tradingview
EUR/USD Shorter-Term Structure
Chasing a move, even with a strong trend, can be problematic; and this is something bulls leaned on the long side of EUR/USD over the past month. While the initial trend was strong in early-April, allowing for a support bounce from the 1.1275 Fibonacci level which led to another fresh high and a test of 1.1500, the next test of 1.1275 didn’t work out so well, and that’s when the pair had started to show a head and shoulders pattern with that price playing as the neckline.
The early-May bounce from 1.1275 pushed into a lower-high, which then drove down to a lower-low at 1.1200 and then another at 1.1100. Along the way, the 1.1200 bounce produced a lower-high resistance test around 1.1275 and that provides some structure for sellers to work with. The high from Friday printed at 1.1293 – and that’s the level that bears need to defend to keep the lower-low/high sequencing in the pair. This means that 1.1275 could come back into play again as a lower-high, but ideally, sellers would jump on a test of 1.1200 to show that bearish anticipation to keep the door open for short-side trends.
The 1.1000 psychological level is the next level of interest below current support, but it’s the 1.0943 Fibonacci level that was contentious back in March and April. Notably, it’s also a level that I spoke of when writing the longer-form article on Fibonacci back in February when, at the time, we had a simple support stall at the 23.6% retracement of that major move. The 50% mark for that trend is at 1.0943 and that’s the major spot of support below current prices, if bears can keep that trend going.
EUR/USD Four-Hour Chart
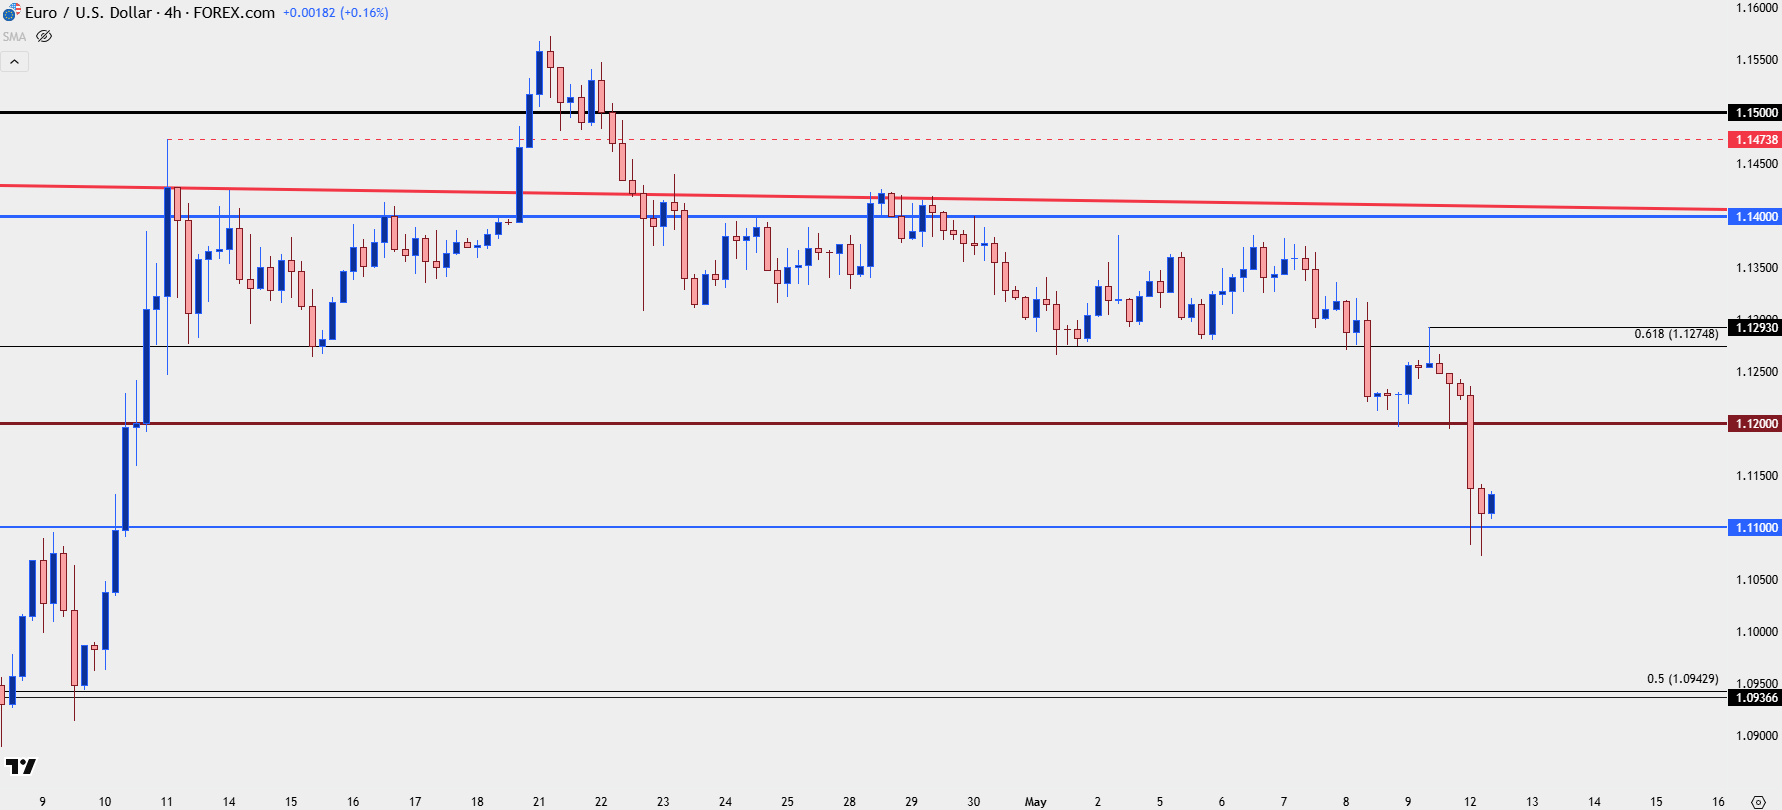 Chart prepared by James Stanley; data derived from Tradingview
--- written by James Stanley, Senior Strategist
Latest market news
September 18, 2025 02:48 PM
June 23, 2025 01:22 PM
June 23, 2025 10:39 AM
June 20, 2025 05:23 PM
June 20, 2025 04:46 PM
June 20, 2025 03:35 PM

September 18, 2025 02:48 PM

June 18, 2025 08:37 PM
June 13, 2025 06:22 PM

June 12, 2025 03:40 PM