

Key Events to Watch
- Alphabet (GOOGL) beats estimates with $2.81 EPS and $90.23B in revenue, keeping US indices near resistance
- DXY holds above 99, while EURUSD tests the 1.13 support zone
- Next week: Key earnings (Microsoft, Meta, Apple, Amazon), US Core PCE, advance GDP, ISM PMIs, and NFP — all likely to challenge major technical zones
US Dollar and Indices Outlook: Bullish Bias Holds — for Now
US indices are trading near key resistance levels, supported by strong Alphabet earnings and a constructive tone in US-China trade negotiations. The DXY remains above the 99-mark, bolstered by recent relief surrounding the Fed’s independence from political influence.
Nasdaq, hovering near the critical 19,400 zone, and the SPX at 5,530, are at pivotal junctures — potentially poised either for a continuation of the broader uptrend or a corrective pullback amid mixed economic data, earnings reports, and headline-driven sentiment. Google’s results emphasized robust AI investment, underscoring the resilience of the tech sector despite trade-related uncertainty.

Looking ahead, next week’s earnings from Microsoft and Meta (Wednesday), followed by Apple and Amazon (Thursday), are expected to be key market drivers, especially against the backdrop of ongoing trade discussions and critical US economic releases.
Macro Data in Focus Next Week: Eurozone vs. US
Eurozone CPI, US Core PCE, advance GDP, ISM PMIs, and NFP will provide key insights into inflation and growth prospects amid ongoing tariff-related risks. These releases are set to test multi-year support and resistance zones in major USD pairs — particularly EURUSD — and could play a pivotal role in shaping the market’s next directional move.

Key Levels to Watch:
EURUSD Forecast: Daily Time Frame – Log Scale
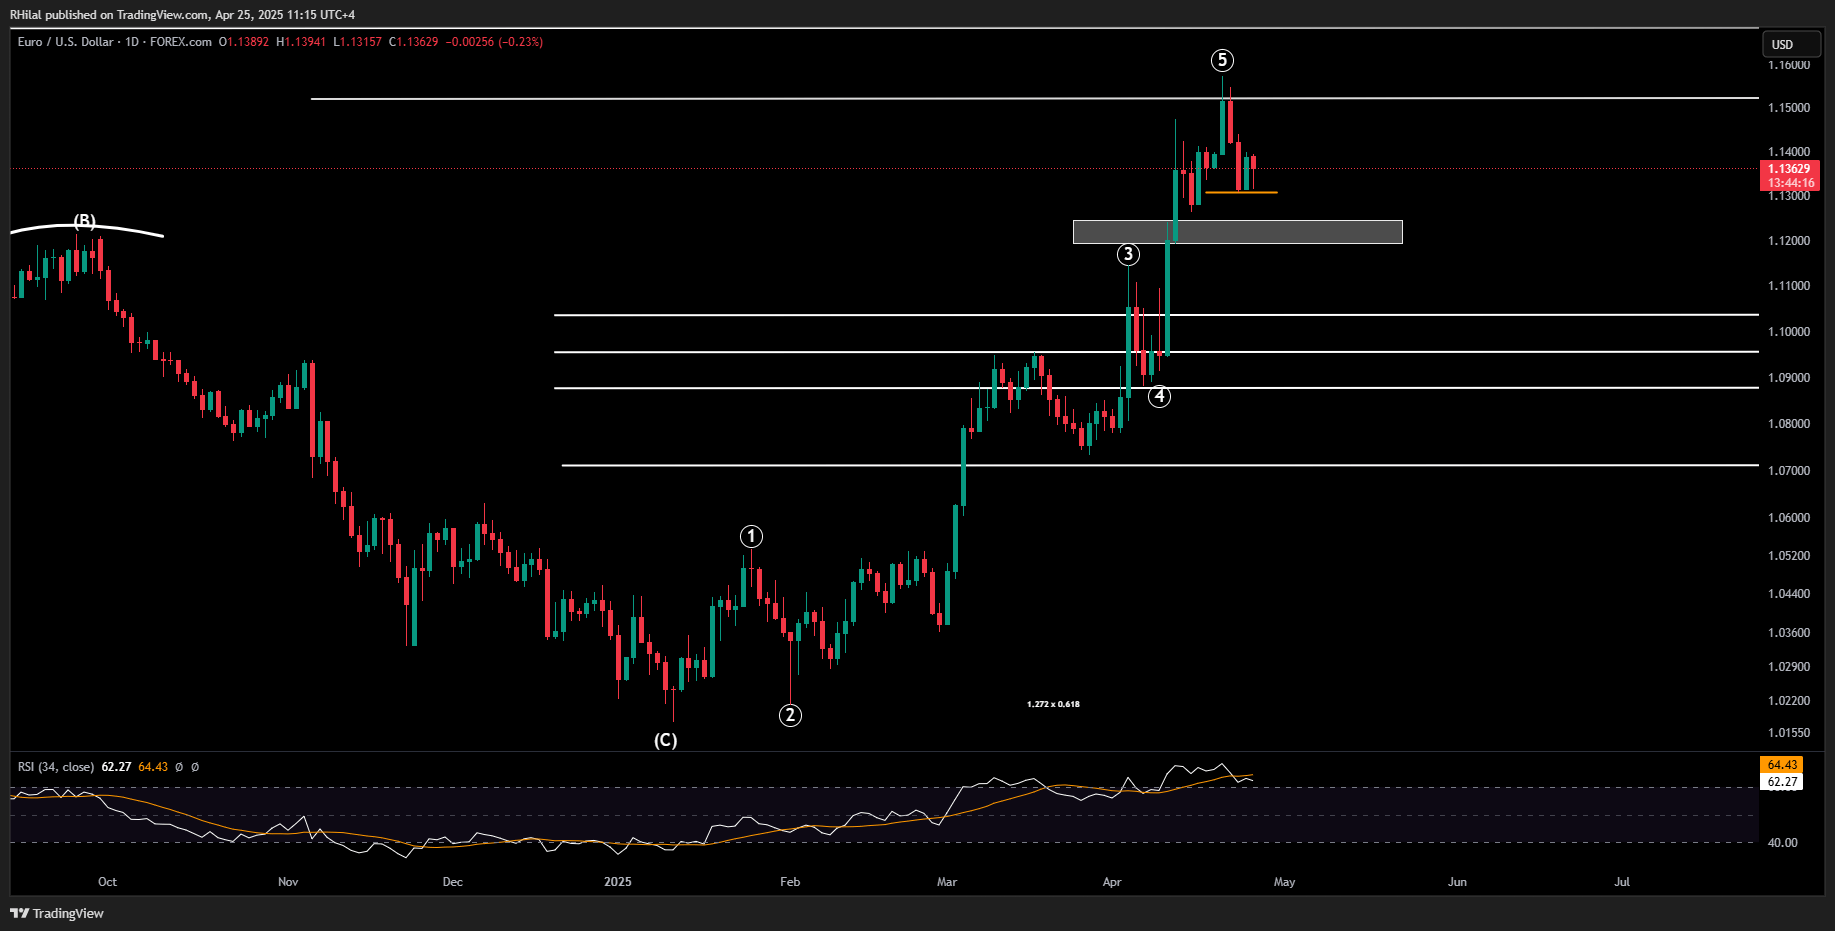
Source: Tradingview
Analyzing EURUSD from the daily and weekly time frames, the oversold conditions on the chart suggest a potential setup for a momentum recharge and possible reversal.
A clean hold below the 1.13 mark may extend losses toward 1.12, 1.1040, 1.0950, and 1.0870 — and, in more extreme cases, 1.07 — where we may see confirmation of either a renewed long-term bearish trend or the early signs of a longer-term bullish reversal against the USD.
EURUSD Forecast: Monthly Time Frame – Log Scale
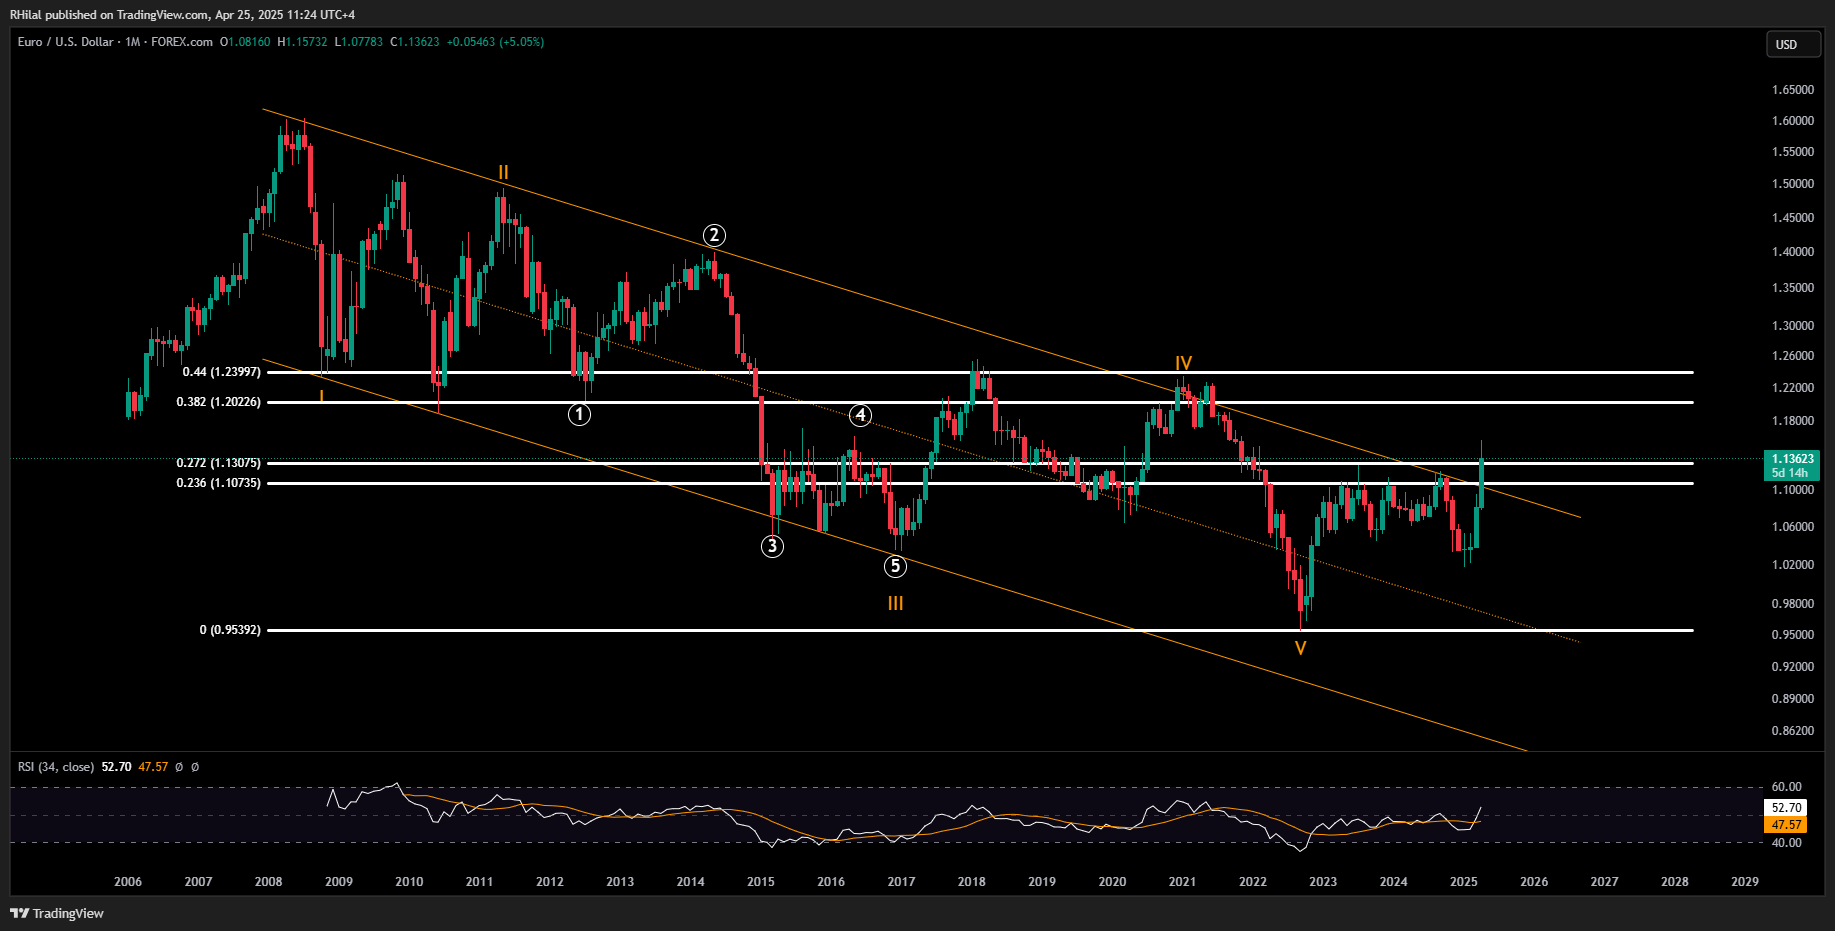
Source: Tradingview
Analyzing the chart from a monthly time frame perspective, the pair’s hold above the declining channel established since 2008 may still point to upside risk, especially following a potential momentum recharge.
A clear hold above 1.16 could extend gains toward 1.17, 1.20, and 1.24 — levels that align with the 2021 highs and key Fibonacci retracement levels of the downtrend extending from 2008 to 2022.
Nasdaq Forecast: Weekly Time Frame – Log Scale
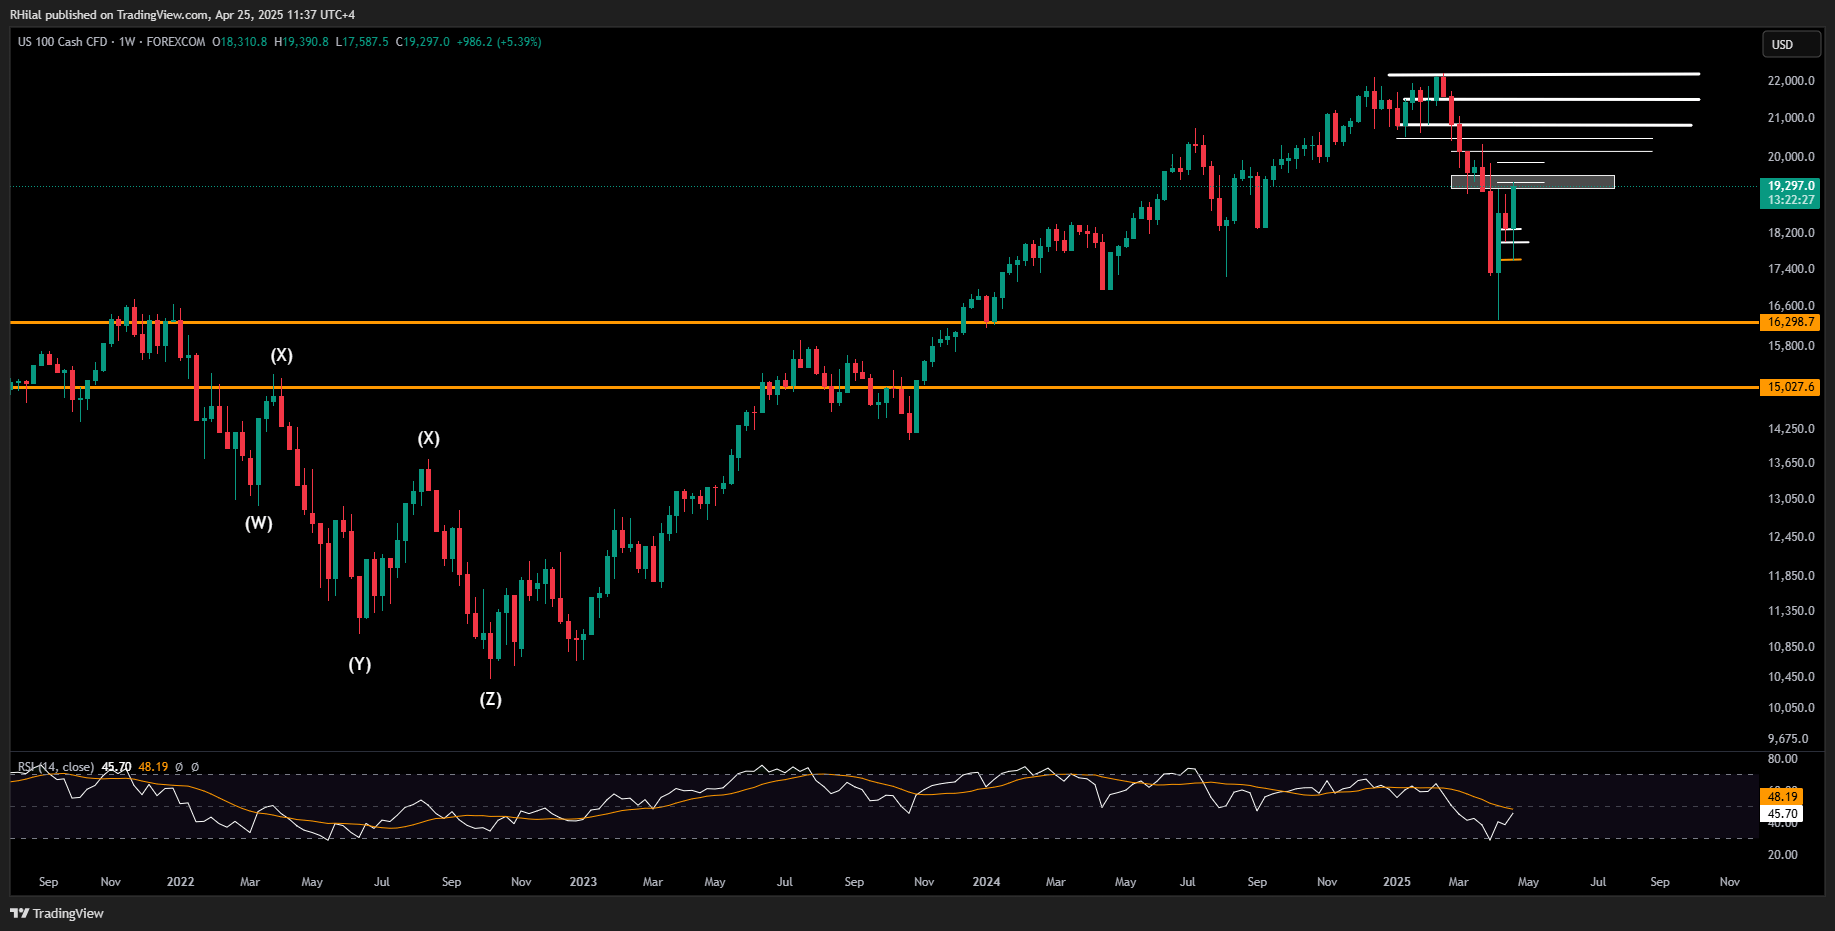
Source: Tradingview
With respect to the Nasdaq, I’ll begin with the weekly time frame to assess the upside potential. The chart continues to show bullish momentum, supported by an RSI rebound from oversold levels last seen in 2022, and is currently testing a key resistance zone between 19,200 and 19,500. A breakout above this range could accelerate the rally toward 19,900, 20,200, 20,800, 21,500, and 22,200, in line with the broader bullish trend. However, with trade negotiations ongoing, key US economic data releases, and major earnings reports on the horizon, volatility risks remain elevated. A failure to hold above 19,200 could trigger a renewed decline toward the 18,000 zone, as outlined in the 4-hour chart below.
Nasdaq Forecast: 4H Time Frame – Log Scale
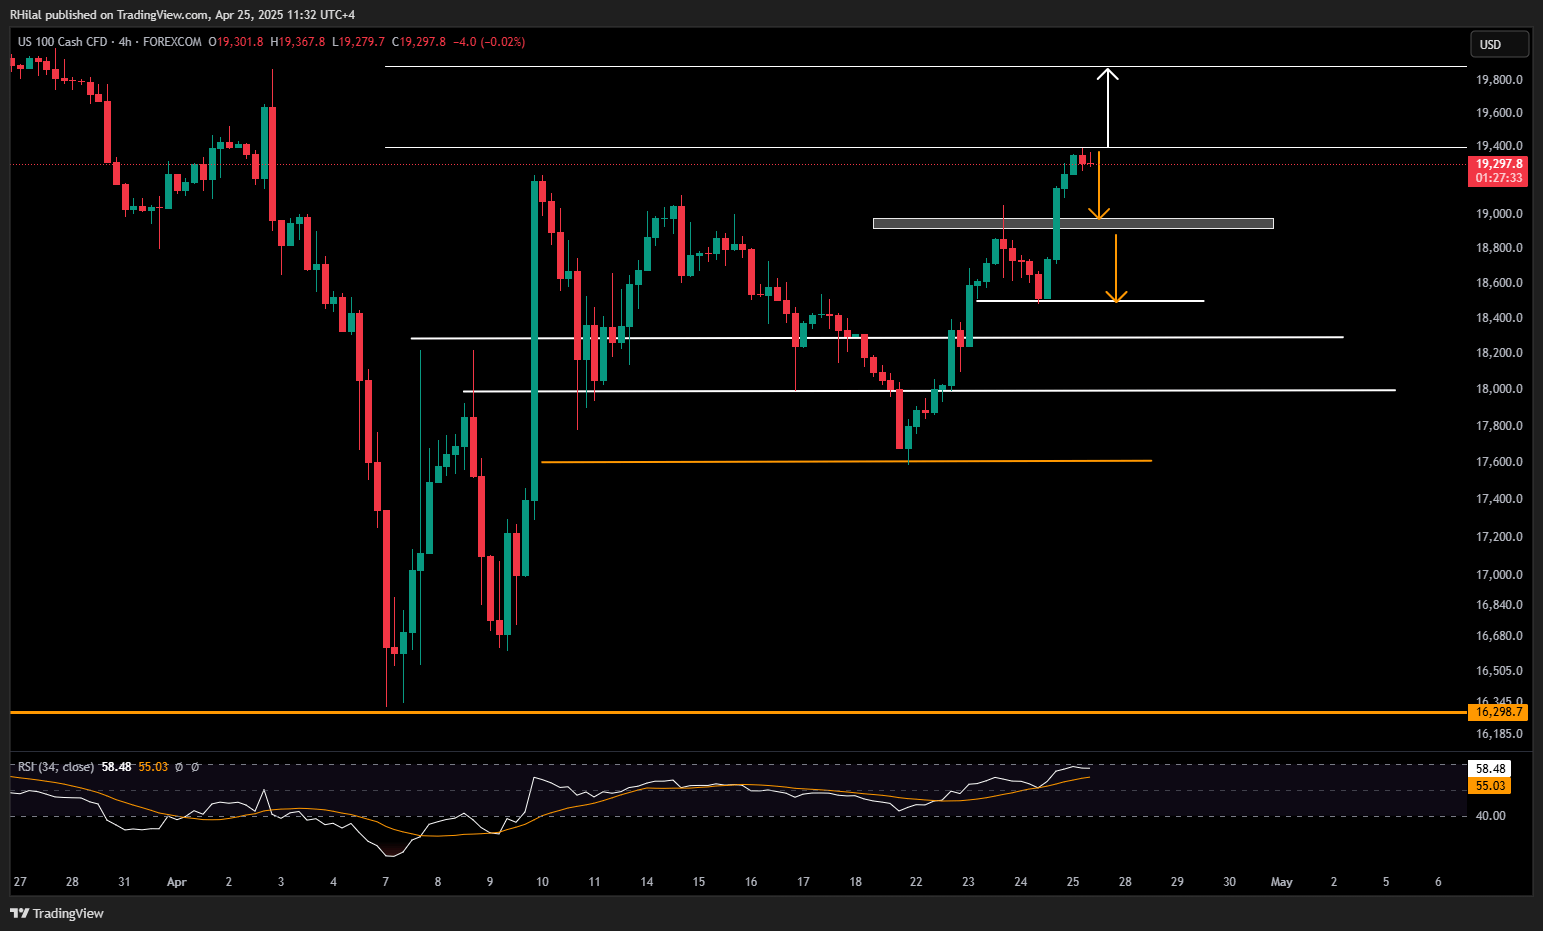
Source: Tradingview
The Nasdaq is currently holding at the 0.610 Fibonacci extension level of the bullish bounce from the 16,300 low, based on the range between 16,300, 19,230, and 17,587 — aligning with a key high time frame resistance zone.
A clean break below 19,200 may extend the decline toward 18,900, 18,500, 18,000 and 17,600 before confirming any deeper downside. Investors may be watching these levels closely for potential dip-buying opportunities in anticipation of a longer-term economic recovery.
Written by Razan Hilal, CMT
Follow on X: @Rh_waves
Latest market news
Yesterday 06:00 PM
Yesterday 04:20 PM
Yesterday 04:18 PM
Yesterday 03:15 PM
Yesterday 11:45 AM

April 10, 2025 10:20 AM

April 9, 2025 11:43 AM

April 7, 2025 09:40 AM

March 27, 2025 09:25 AM