

US Dollar Outlook: EUR/USD
EUR/USD attempts to retrace the decline from the start of the week amid an unexpected slowdown in the US Consumer Price Index (CPI), and the exchange rate may continue to track the positive slope in the 50-Day SMA (1.1085) following the failed attempt to close below the moving average.
EUR/USD Rebounds Following Failed Attempt to Close Below 50-Day SMA
EUR/USD continues to bounce back from a fresh monthly low (1.1066) as the US CPI narrows to 2.3% in April from 2.4% per annum the month prior, and the exchange rate may stage a larger recovery as it halts the series of lower highs and lows carried over from last week.
Join David Song for the Weekly Fundamental Market Outlook webinar.
David provides a market overview and takes questions in real-time. Register Here
In turn, EUR/USD may defend the bullish trend from earlier this year even as the Trump administration pauses the reciprocal tariffs for China, and data prints coming out of the US may continue to drag on the Greenback amid signs of a weakening economy.
US Economic Calendar
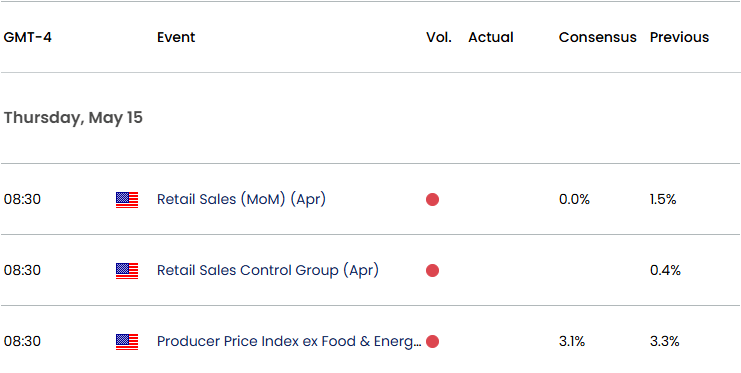
Looking ahead, Retail Sales are expected to hold flat in April while the Producer Price Index (PPI) is seen narrowing to 3.1% from 3.3% in March, and indications of slowing consumption may lead to a further recovery in EUR/USD as it fuels speculation for lower US interest rates.
At the same time, a batch of positive US data prints may keep the Federal Reserve on the sidelines amid the ongoing shift in fiscal policy, and EUR/USD may continue to threaten the positive slope in the 50-Day SMA (1.1085) as there appears to be a shift in US Dollar sentiment.
With that said, failure to hold above the moving average may indicate potential change in trend, and EUR/USD may struggle to retain the rebound from the April low (1.0778) as the recent weakness in the exchange rate pushes the Relative Strength Index (RSI) to its lowest level since February.
EUR/USD Chart – Daily
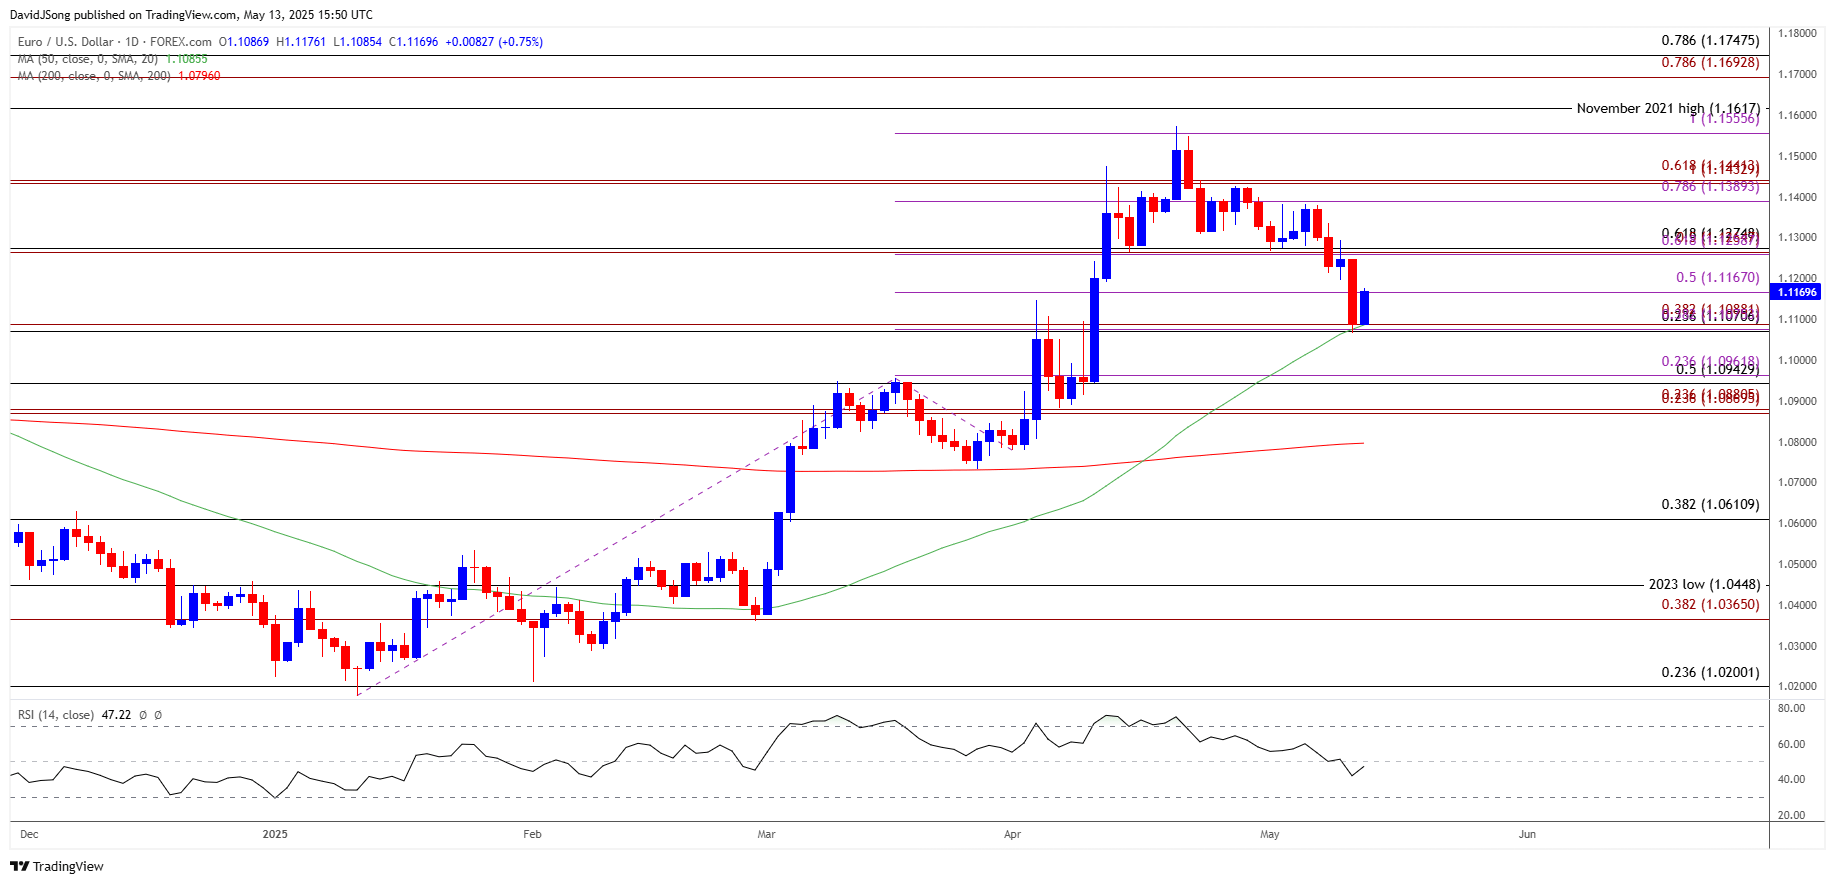
Chart Prepared by David Song, Senior Strategist; EUR/USD on TradingView
- EUR/USD no longer carves a series of lower highs and lows after testing the 50-Day SMA (1.1085) for the first time since March, and the exchange rate may continue to track the positive slope in the moving average amid the failed attempt to close below the 1.1070 (23.6% Fibonacci retracement) to 1.1090 (38.2% Fibonacci extension) region.
- Need a move back above 1.1170 (50% Fibonacci retracement) to bring the 1.1260 (61.8% Fibonacci extension) to 1.1280 (61.8% Fibonacci retracement) zone back on the radar, with the next area of interest coming in around the monthly high (1.1381).
- However, a close below the 1.1070 (23.6% Fibonacci retracement) to 1.1090 (38.2% Fibonacci extension) region may push EUR/USD towards the 1.0940 (50% Fibonacci retracement) to 1.0960 (23.6% Fibonacci extension) zone, with the next area of interest coming in around 1.0870 (23.6% Fibonacci extension) to 1.0880 (23.6% Fibonacci extension).
Additional Market Outlooks
GBP/USD on Track to Test Positive Slope in 50-Day SMA
Canadian Dollar Forecast: USD/CAD Breaks Out of Descending Channel
USD/JPY Falls from Fresh Monthly High to Hold Below 50-Day SMA
Gold Price Weakness Keeps RSI Out of Overbought Territory
--- Written by David Song, Senior Strategist
Follow on Twitter at @DavidJSong

Latest market news
September 18, 2025 02:48 PM
June 23, 2025 01:22 PM
June 23, 2025 10:39 AM
June 20, 2025 05:23 PM
June 20, 2025 04:46 PM
June 20, 2025 03:35 PM

September 18, 2025 02:48 PM

June 18, 2025 07:38 PM
June 18, 2025 03:24 PM

June 17, 2025 07:15 PM