
• GBP/USD forecast: Cable risks a near‑term pullback as trade optimism potentially boosts USD
• Trade‑talk optimism is keeping risk assets supported ahead of the 8 July tariff deadline
• Key UK jobs and US inflation data coming up this week
It has been a decidedly subdued open to Monday’s session, but things will pick up as the week unfolds. US‑China envoys are meeting in London for the first time since the two sides stopped all trade talks. No‑one expects a grand accord, but some sort of agreement to continue trade talks and the resumption of some rare‑earth exports would constitute progress. Still, with the 90‑day tariff cease‑fire expiring on 8 July, any hint of détente keeps risk appetite afloat and, by extension, offers a modest prop to US dollar via the risk channel in our GBP/USD forecast. The White House plainly wants tangible wins before the tariff clock runs down. A mis‑step could sour sentiment sharply, so traders should keep one eye on the headlines.

GBP/USD forecast: UK labour market first out of the traps
Fundamentals take centre stage from Tuesday. The UK labour report will test the pound’s resilience; unemployment has been sticky but pay growth has wobbled. A softer wage print would strengthen the Bank of England’s dovish chorus and, in our GBP/USD forecast, reinforce downward pressure.
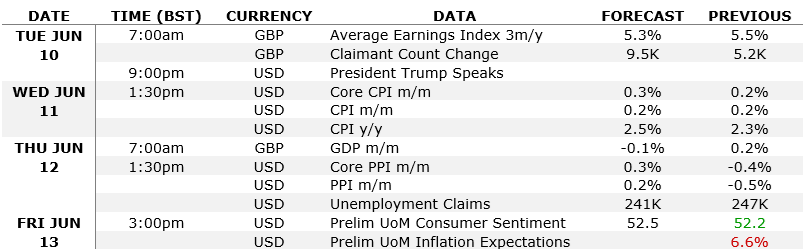
The mid‑week spotlight then swings stateside. Wednesday brings US CPI followed on Thursday by PPI. Also on Thursday, we receive the UK’s monthly GDP estimate. With both sides of the pair delivering heavyweight numbers within 24 hours, volatility should pick up markedly from Wednesday lunchtime onwards.
Here is a list of the key data coming up this week, relevant only for the GBP/USD forecast.
GBP/USD technical analysis: Cable stalls at 1.36
Sterling managed a grudging weekly gain, yet the bulls could not crack the 1.3600 barricade, leaving a small bearish-looking reversal candle on Thursday. So, it looks like the path of least resistance could be changing from being to the upside to a bit on the downside, towards sub 1.3500—a key pivotal level. Below that psychological level lies the September 2024 high at 1.3434. Things will get interesting if we go below these levels.
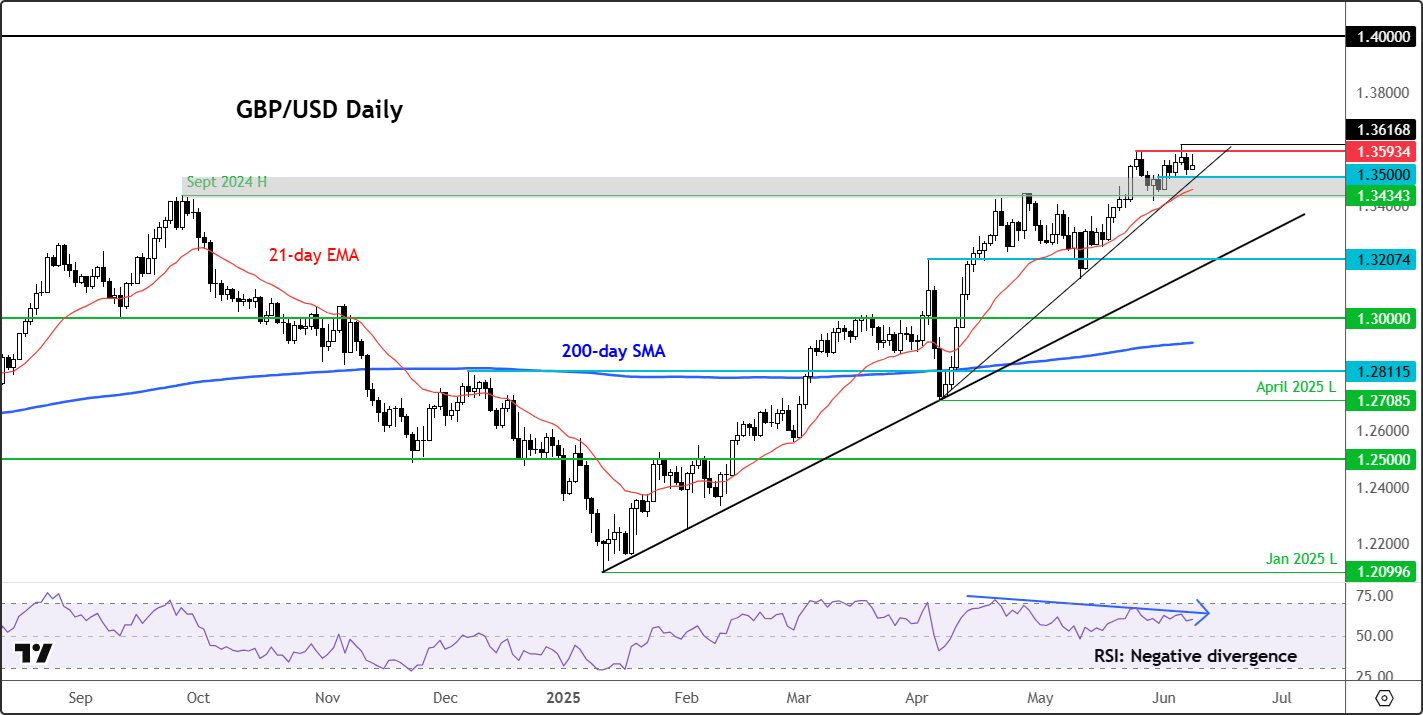
For now, the daily chart of the GBP/USD hangs in a holding pattern, caught between tentative trade‑talk optimism and an imminent barrage of high‑stakes data. A decisive break above 1.36 would re‑energise the rally, opening a path to 1.38, but absent that trigger the near‑term bias tilts to a corrective dip towards 1.3400 and lower.
Looking at the monthly chart of the GBP/USD, we can see that rates have now entered a massif region of resistance between 1.35 to 1.40.
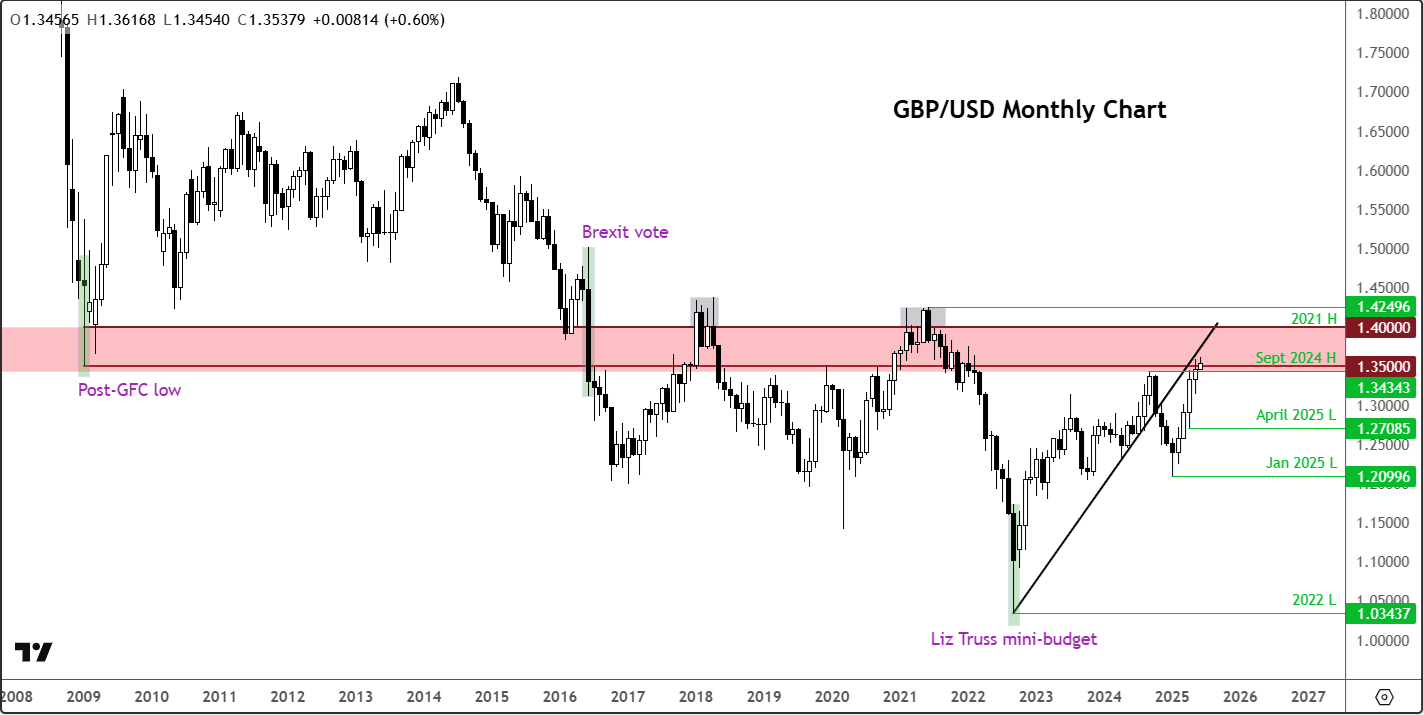
Since the post-Brexit breakdown below this 1.35-1.40 area, the cable has struggled to rise back above this zone on numerous occasions. This time, it is having another crack at it following a 4-month rally. Can the bulls manage a breakthrough this time around or will the bears prevail.
What happens here will have a big influence in the near-term direction. For example, a breakout above this key pivotal area could lead to further technical buying in the months ahead, while if we observes the formation of a bearish reversal here, then this could at least provide sizable drop, even if ultimately we see a breakout later in the year.
Source for all charts used in this article: TradingView.com
-- Written by Fawad Razaqzada, Market Analyst
Follow Fawad on Twitter @Trader_F_R
Latest market news
September 18, 2025 02:48 PM
June 23, 2025 01:22 PM
June 23, 2025 10:39 AM
June 20, 2025 05:23 PM
June 20, 2025 04:46 PM
June 20, 2025 03:35 PM

June 20, 2025 03:35 PM

June 19, 2025 09:09 AM

June 18, 2025 02:55 PM

June 18, 2025 08:19 AM