

British Pound Outlook: GBP/USD
GBP/USD falls to a fresh monthly low (1.3140) as the US and China agree to pause the reciprocal tariffs for 90-days, and the exchange rate may struggle to retain the advance from the April low (1.2709) should it no longer respond to the positive slope in the 50-Day SMA (1.3084).
GBP/USD on Track to Test Positive Slope in 50-Day SMA
GBP/USD extends the decline following the US-UK trade deal with the Trump administration on track to avoid a trade war, and the exchange rate may continue to carve a series of lower highs and lows as there appears to be a shift in US Dollar sentiment.
Join David Song for the Weekly Fundamental Market Outlook webinar.
David provides a market overview and takes questions in real-time. Register Here
In turn, developments coming out of the US may continue to sway GBP/USD amid the ongoing transition in fiscal policy, and data prints coming out of the UK may keep the exchange rate under pressure as the jobs report is anticipated to show a weakening labor market.
UK Economic Calendar

The UK Claimant Count is expected to increase 22.3K in April while the Unemployment Rate is seen widening to 4.5% during the three months through March from 4.4%, and signs of a slowing economy may drag on the British Pound as it puts pressure on the Bank of England (BoE) to implement lower interest rates.
At the same time, a slew of better-than-expected UK data prints may push the BoE to the sidelines as the central bank insists that ‘a gradual and careful approach to the further withdrawal of monetary policy restraint remains appropriate,’ and the recent weakness in GBP/USD may turn out to be temporary as the ongoing change in trade policy clouds the outlook for the US economy.
With that said, GBP/USD may track the positive slope in the 50-Day (1.3084) should it continue to hold above the moving average, but the weakness in the exchange rate may persist as it extends the series of lower highs and lows from last week.
GBP/USD Price Chart – Daily
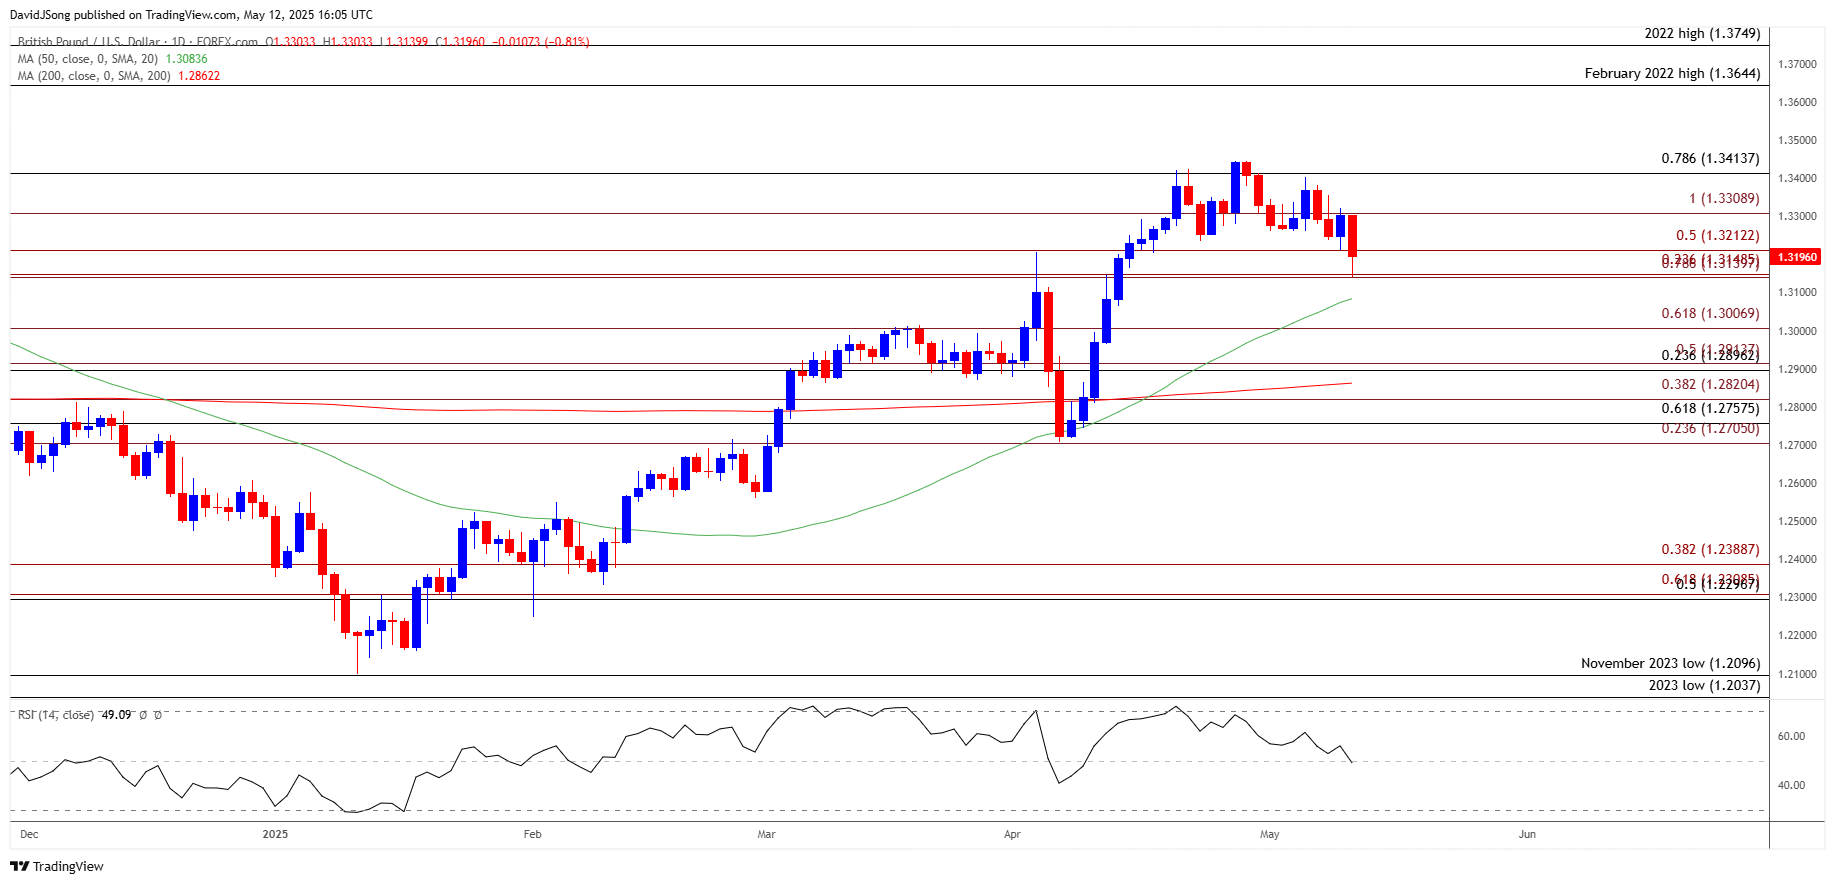
Chart Prepared by David Song, Senior Strategist; GBP/USD on TradingView
- GBP/USD extends the series of lower highs and lows as it falls to a fresh monthly low (1.3140), with a break/close below the 1.3140 (78.6% Fibonacci extension) to 1.3150 (23.6% Fibonacci extension) region raising the scope for a move towards 1.3010 (61.8% Fibonacci extension).
- Next area of interest comes in around 1.2900 (23.6% Fibonacci retracement) to 1.2910 (50% Fibonacci extension), with a break/close below 1.2820 (38.2% Fibonacci extension) opening up the 1.2710 (23.6% Fibonacci extension) to 1.2760 (61.8% Fibonacci retracement) zone.
- At the same time, lack of momentum to below the 1.3140 (78.6% Fibonacci extension) to 1.3150 (23.6% Fibonacci extension) region may push GBP/USD back towards 1.3310 (100% Fibonacci extension), with a move above 1.3410 (78.6% Fibonacci retracement) raising the scope for a test of the April high (1.3445).
Additional Market Outlooks
Canadian Dollar Forecast: USD/CAD Breaks Out of Descending Channel
USD/JPY Falls from Fresh Monthly High to Hold Below 50-Day SMA
Gold Price Weakness Keeps RSI Out of Overbought Territory
Australian Dollar Forecast: AUD/USD Threatens December High
--- Written by David Song, Senior Strategist
Follow on Twitter at @DavidJSong

Latest market news
September 18, 2025 02:48 PM
June 23, 2025 01:22 PM
June 23, 2025 10:39 AM
June 20, 2025 05:23 PM
June 20, 2025 04:46 PM
June 20, 2025 03:35 PM

June 20, 2025 03:35 PM

June 19, 2025 09:09 AM

June 18, 2025 02:55 PM

June 18, 2025 08:19 AM