

View related analysis:
- Gold forecast: Another solid run, though a 3k shakeout seems likely
- Traders Placed Bets Against VIX and Swiss Franc Ahead of Tariffs: COT Report
- AUD/USD Bears Eye Sustainable Move to the 50s Amid Tariff Turmoil
- If Consumers Don’t Consume, a Recession Could be Presumed
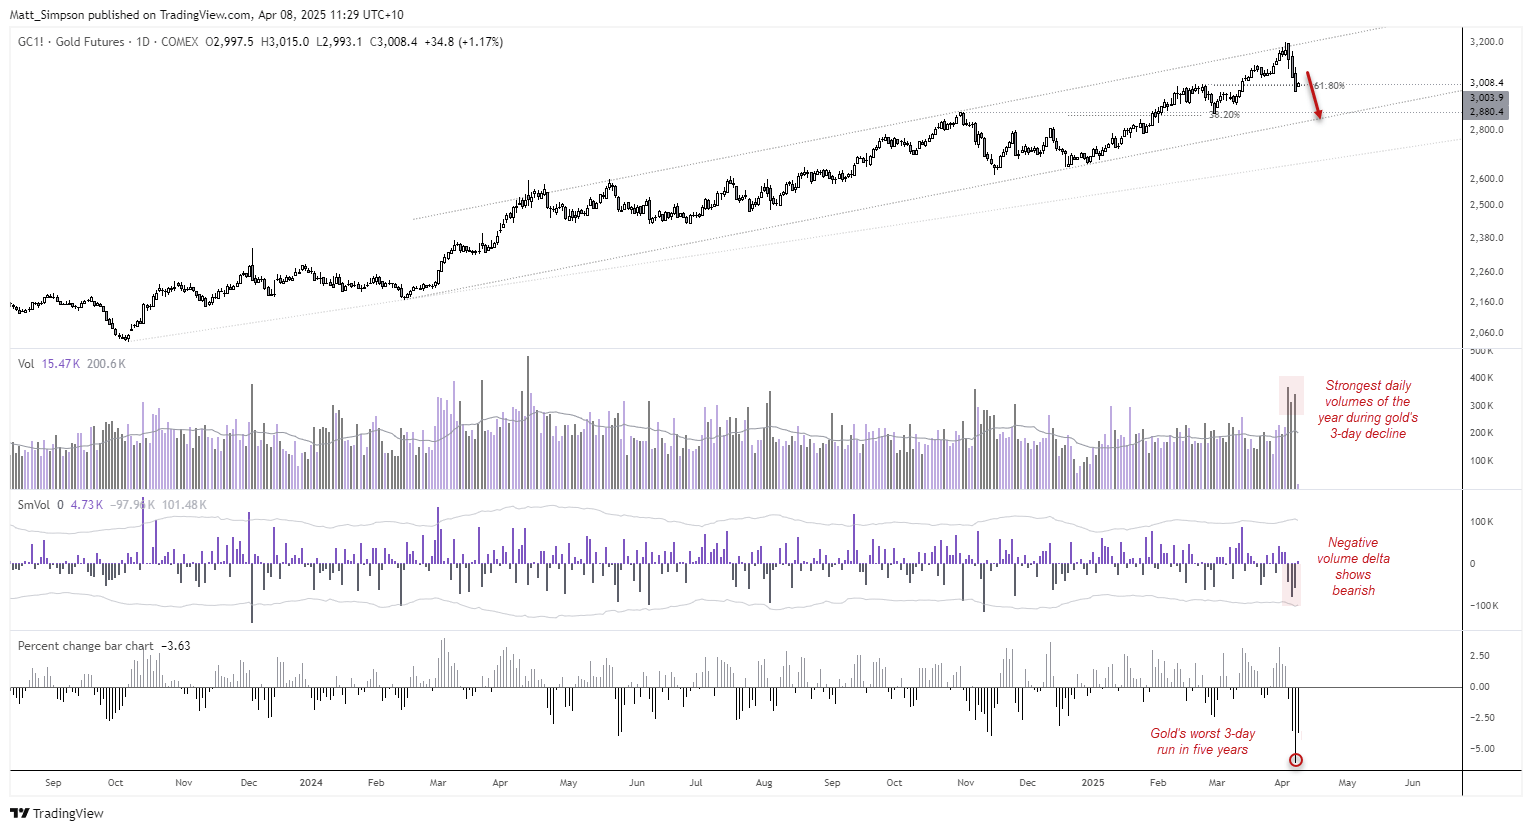
Gold is usually considered to be a safe-haven asset, which generally makes it a ‘go to’ market during times of turbulence. It may therefore seem confusing to some that gold has just suffered its worst 3-day run since the pandemic in light of recent events.
But it begins to make more sense when we consider the genuine level of fear in the air, over a potential global recession stemming from Trump’s trade war. And that is weighing dearly on gold prices, as investors either move to cash to avoid the calamity of market volatility, or are liquidating winning gold trades to nurse losses elsewhere.
Gold technical analysis (daily chart)
Gold briefly pushed above the top of its year-long bullish channel last week, peaking at $3,200. However, the move appears overstretched. Over the past three sessions, the metal has seen elevated volatility and the highest daily trading volumes of the year.
Notably, delta volume has turned negative—suggesting selling pressure is growing. This combination of falling prices and rising volume often signals panic and prompts further liquidation. With bond yields also rising, gold looks vulnerable to a pullback toward the lower bound of its trend channel, near the October high around $2,880.

Bond bears returned to push yields higher
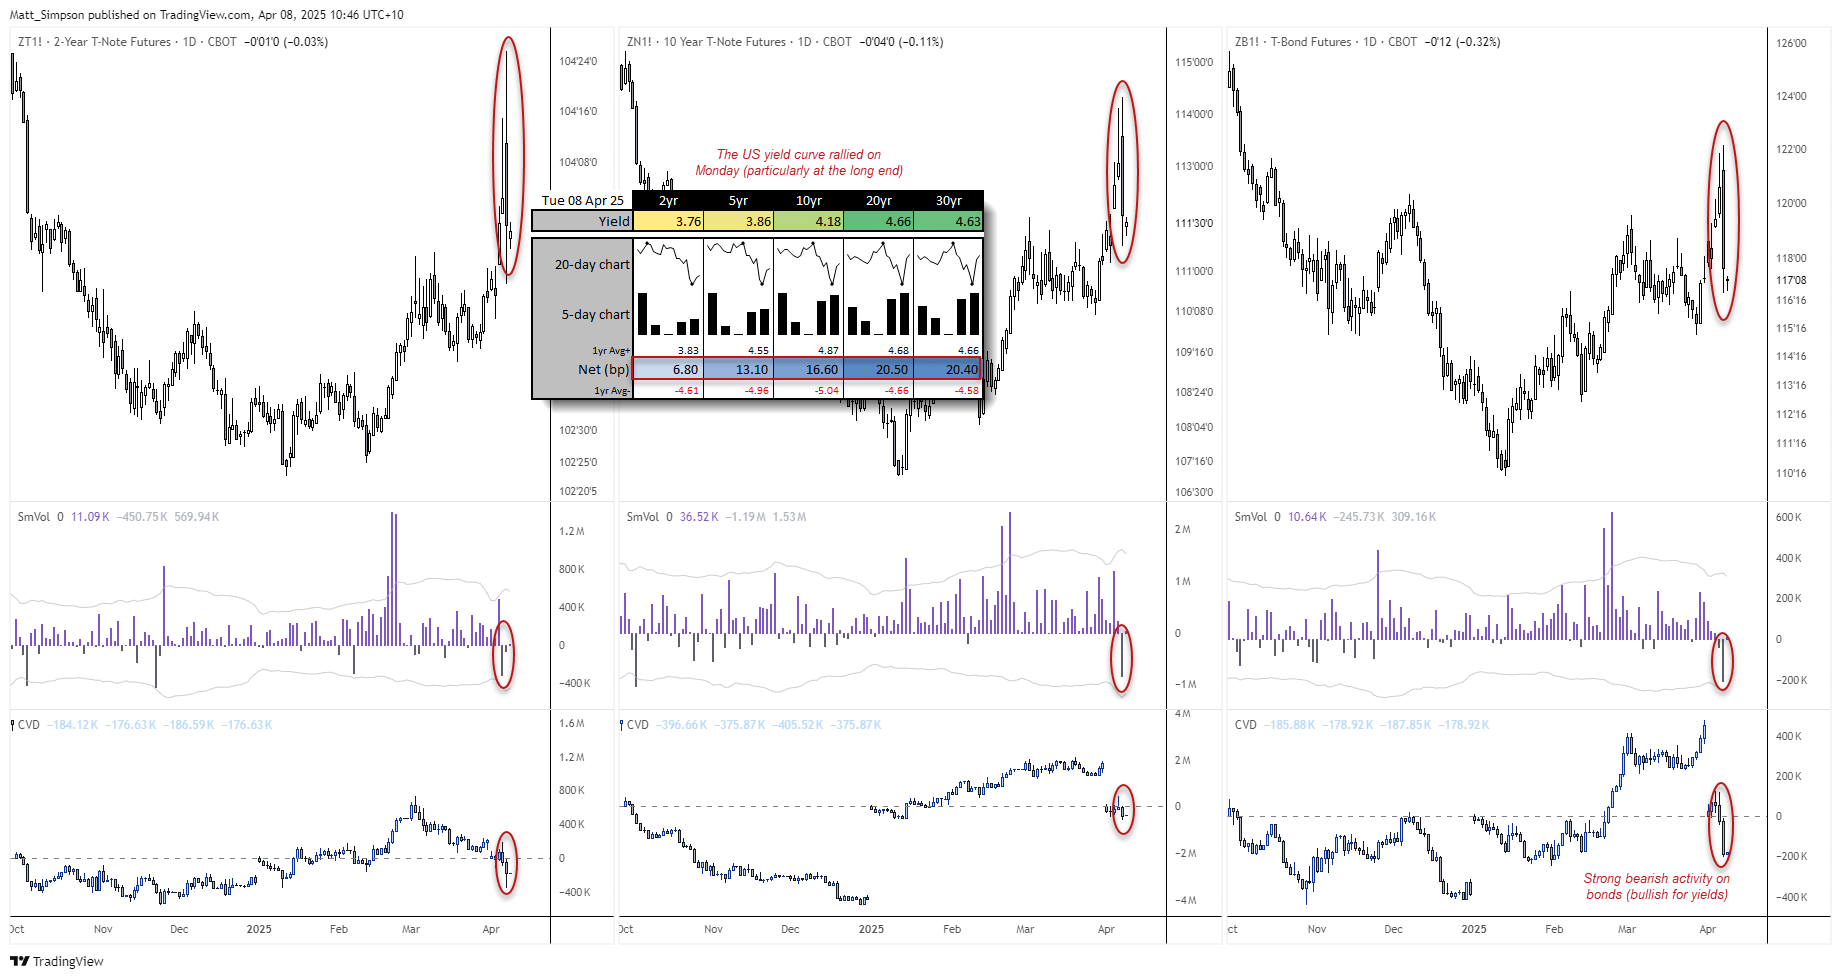
On Monday, the US yield curve steepened sharply, especially at the long end. Yields on 20- and 30-year Treasuries jumped over 20 basis points—more than four times the average daily gain over the past year. Shorter maturities also rose, with 2- and 5-year yields up 7 and 14 basis points respectively.
Though such moves might suggest a “risk-on” environment, the scale and nature of the shift point instead to a wave of selling. Traders appear to be demanding higher yields to stay in the market, not chasing risk. Bond futures data supports this, showing a strong negative volume delta—indicating more selling pressure than buying interest.

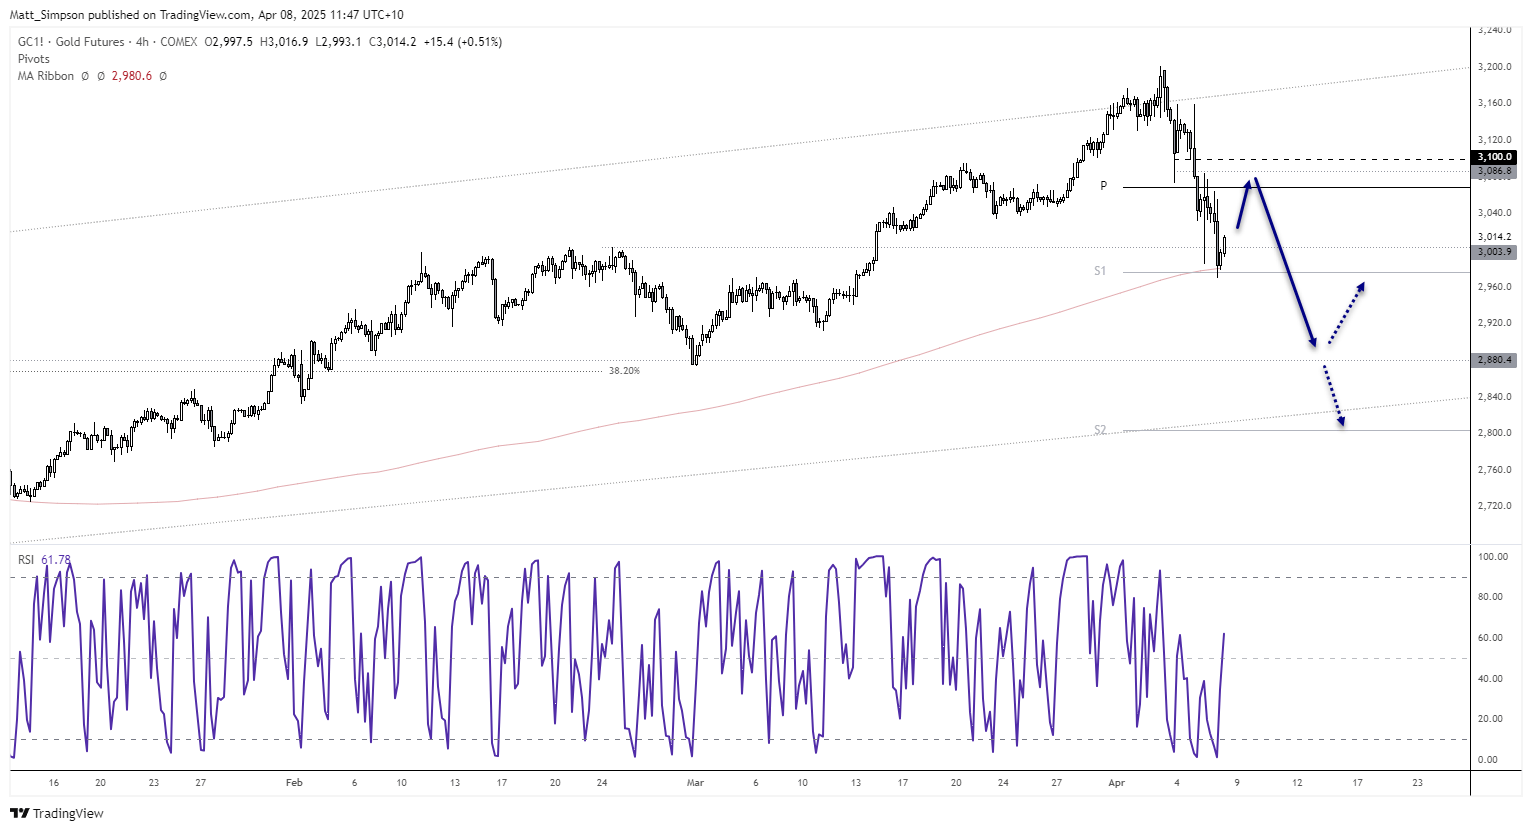
Gold technical analysis (1-hour chart)
While a move down to at least 2880 seems feasible, 2800 is also ap possibility given its round-number status and the fact the monthly S2 pivot point resides there.
But it also appears that gold is set for a small bounce from the 50-day SMA and monthly S1 pivot point.
- A bearish bias is preferred while prices remain beneath 8100
- Bears could seek to fade into moves towards the monthly pivot point (3069)
- Downside targets could include 3000, 2880 and 2,800.
-- Written by Matt Simpson
Follow Matt on Twitter @cLeverEdge
Latest market news
September 18, 2025 02:48 PM
June 23, 2025 01:22 PM
June 23, 2025 10:39 AM
June 20, 2025 05:23 PM
June 20, 2025 04:46 PM
June 20, 2025 03:35 PM

May 28, 2025 03:30 PM

May 16, 2025 08:50 AM

April 17, 2025 11:48 AM

March 27, 2025 04:35 PM