

Gold Price Outlook: XAU/USD
The price of gold falls toward 50-Day SMA ($3081) as it snaps the range bound price action from earlier this week.
Gold Price Falls Toward 50-Day SMA
The price of gold carves a series of lower highs and lows as it slips to a fresh weekly low ($3202), and the precious metal may no longer reflect the bullish trend from earlier this year should it trade below the moving average for the first time since January.
Join David Song for the Weekly Fundamental Market Outlook webinar.
David provides a market overview and takes questions in real-time. Register Here
With that said, the advance from the April low ($2957) may continue to unravel should the bearish price series persist, but the recent weakness in the price of gold may turn out to be temporary as it remains an alternative to fiat-currencies.
XAU/USD Price Chart – Daily
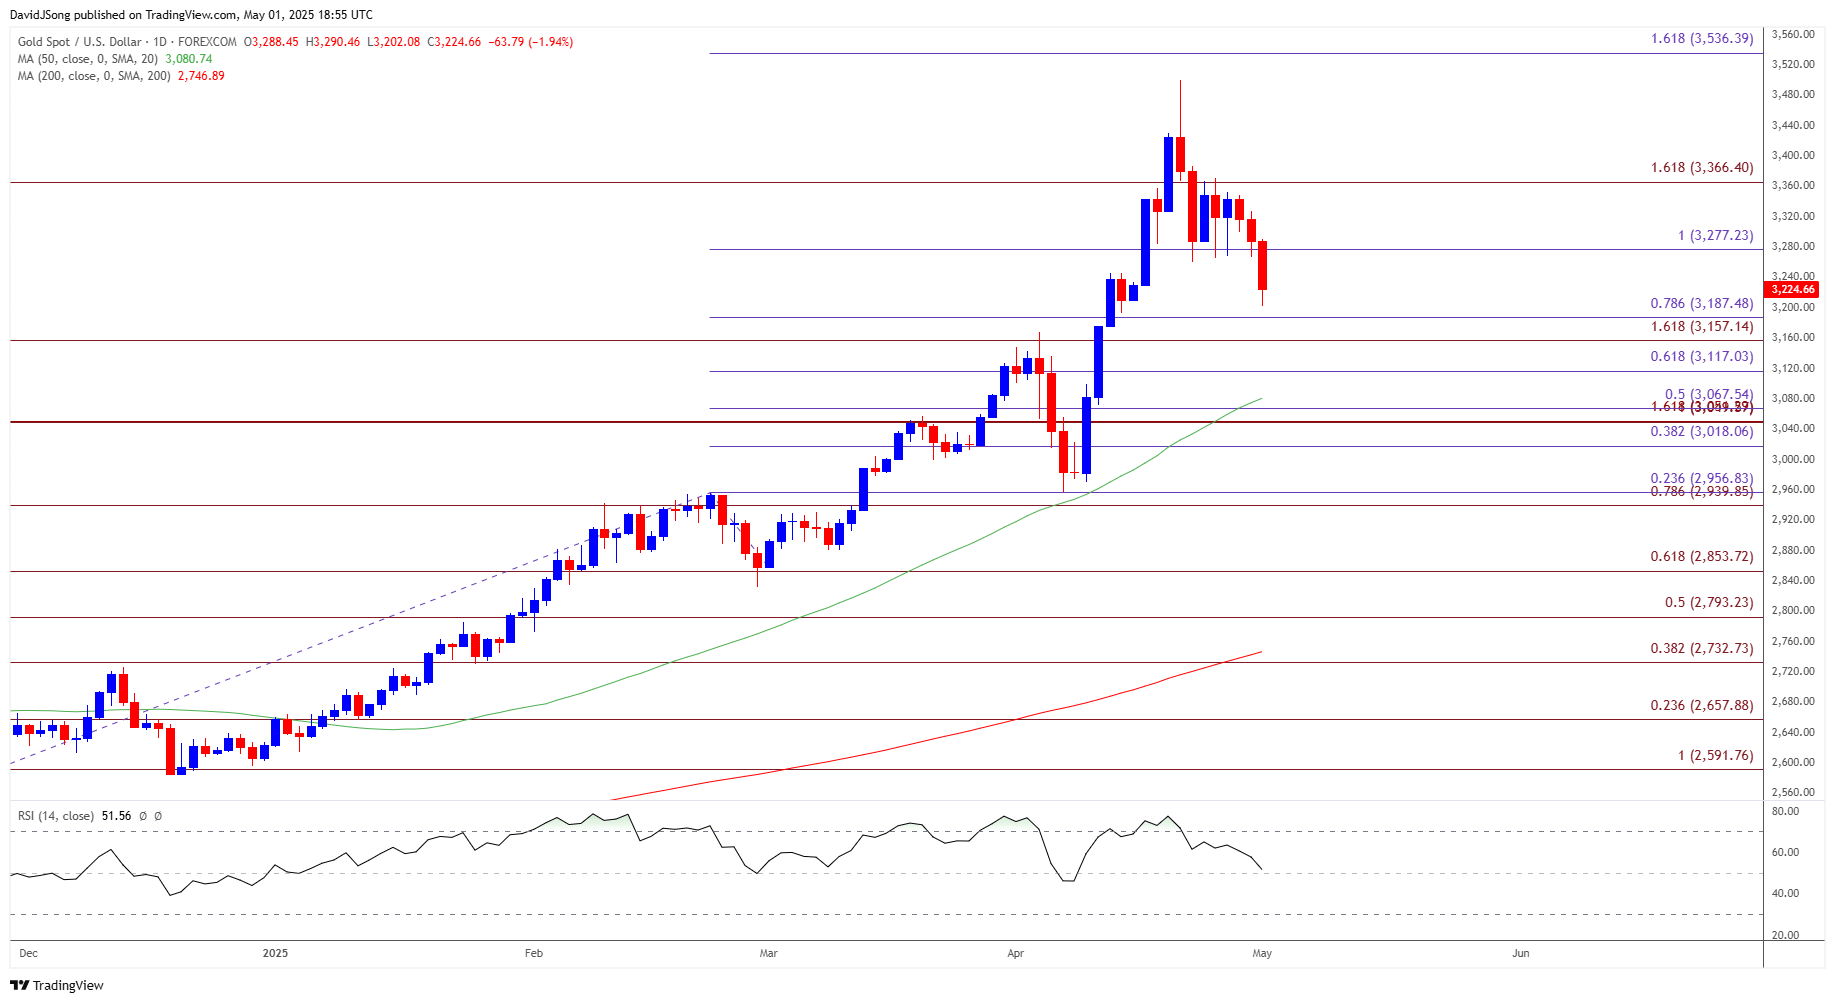
Chart Prepared by David Song, Senior Strategist; XAU/USD on TradingView
- The price of gold gives back the advance from the start of the week to carve a series of lower highs and lows, with a break/close below the $3160 (161.8% Fibonacci extension) to $3190 (78.6% Fibonacci extension) region bringing $3120 (61.8% Fibonacci extension) on the radar.
- Next area of interest comes in around $3050 (100% Fibonacci extension) to $3070 (50% Fibonacci extension), but the price of gold may continue to track the positive slope in the 50-Day SMA ($3081) should it hold above the moving average.
- Need a move back above $3280 (100% Fibonacci extension) for bullion to threaten the bearish price series, with a move/close above $3370 (161.8% Fibonacci extension) raising the scope for a test of the April high ($3500).
Additional Market Outlooks
Canadian Dollar Forecast: USD/CAD Vulnerable to Fresh Yearly Lows
US Non-Farm Payrolls (NFP) Report Preview (APR 2025)
USD/JPY Defends Rebound from Monthly Low Ahead of BoJ Rate Decision
British Pound Forecast: GBP/USD on Cusp of Testing 2024 High
--- Written by David Song, Senior Strategist
Follow on X at @DavidJSong

Latest market news
September 18, 2025 02:48 PM
June 23, 2025 01:22 PM
June 23, 2025 10:39 AM
June 20, 2025 05:23 PM
June 20, 2025 04:46 PM
June 20, 2025 03:35 PM

September 18, 2025 02:48 PM

June 18, 2025 08:37 PM

June 13, 2025 06:22 PM

June 12, 2025 03:40 PM