Gold, XAU/USD Talking Points:
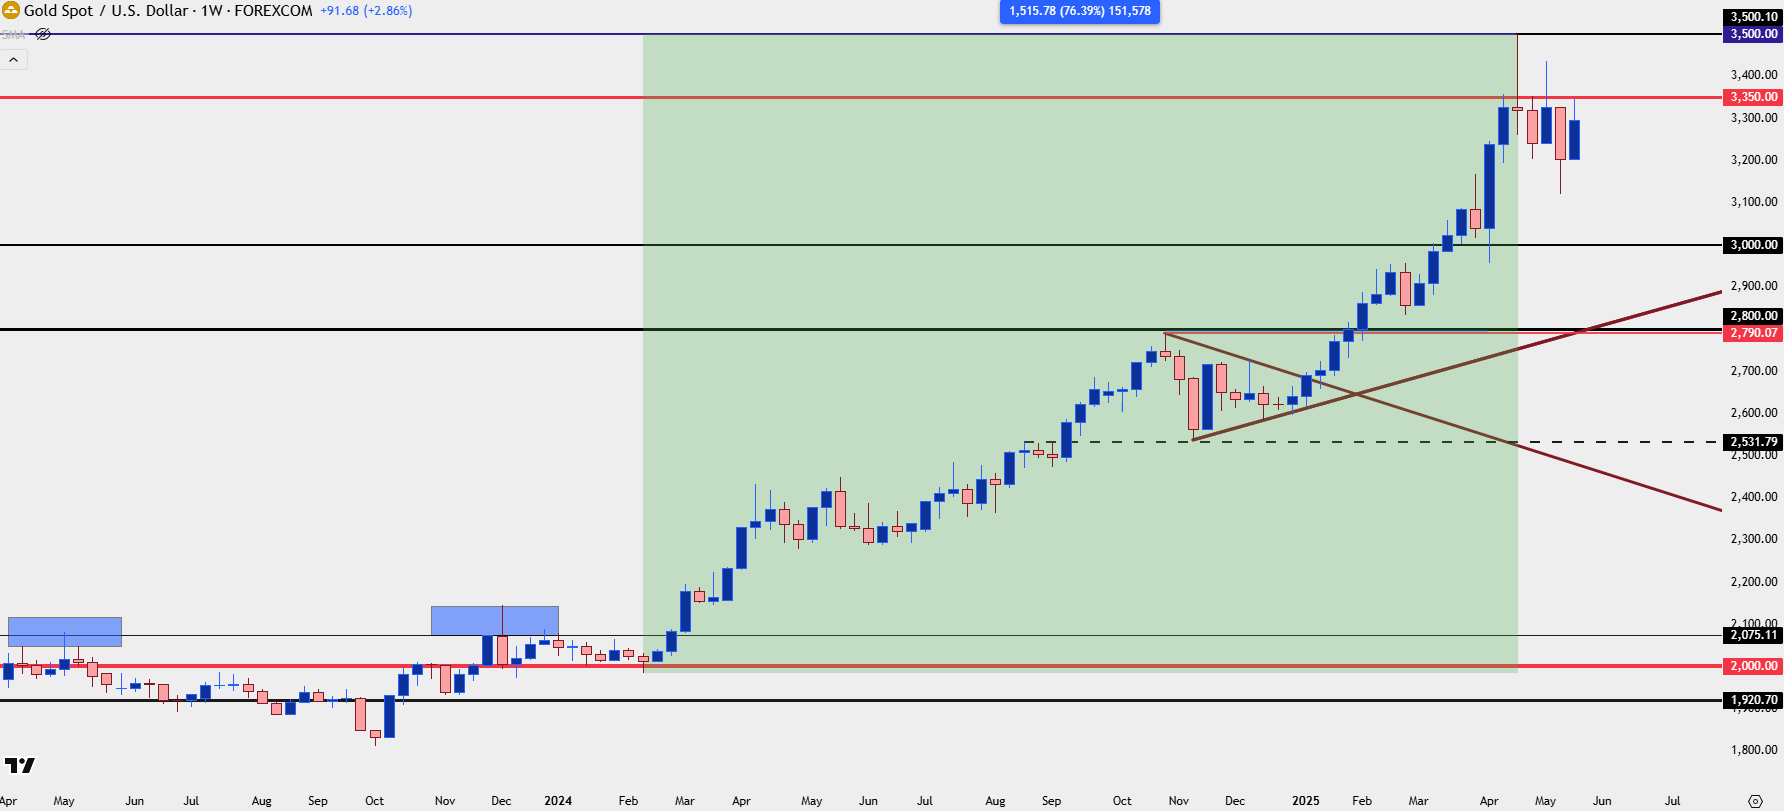
- Gold has rallied as much as 76.4% over the past 15 months and there’s only been a minimum of pullback along the way.
- The $3500 level so far has capped the rally but inside of that, the $3350/oz level has been a stumbling block for bulls as it’s held resistance on the weekly for the past six weeks.
- Despite that, buyers have remained persistent, as looked at in last Friday’s webinar when support was coming into play from prior resistance, leading to another run at the $3350 level.
- I look at gold in-depth in each weekly webinar and you’re welcome to join the next: Click here to register.
The rally in gold remains impressive as the metal has rallied by as much as 76.4% from the lows of last February. There’s only been brief pause along the way, such as the bull pennant that formed in Q4 around the Presidential Election. More recently, however, bulls have been stalled after a test at a major psychological level of $3500, which showed up in late-April, right around the time that the USD began to test some significant long-term support.
While that very clear line in the sand sets the high watermark, there’s also been a tendency for resistance to show at the $3350 level, and that’s back in-play this week following the rally from support at the $3150 level.
I had talked about that setup in the webinar last Friday, attempting to locate a short-term higher-low to allow bullish setups for another run at that resistance. So far, that’s played out, but buyers still lack the ability to take out $3350 and this begs the question as to whether a larger pullback might be in store.
Gold Weekly Price Chart
 Chart prepared by James Stanley; data derived from Tradingview
Gold Shorter-Term Strategy
While technical analysis is not perfectly predictive – because it is based on the past and the past does not predict the future – it can be quite helpful for taking an objective look at a market environment. It may not hold all the answers, like the ‘why’ behind the 76.4% rally that showed in gold over a 15 month period, but it certainly helps to illustrate the ‘what’ with clarity, and from that we can draw deductions as to the ‘why’ behind the matter.
And from technical analysis a couple of very simple tools can offer value, such as the very human behavioral pattern that tends to focus on round numbers. This is why prices like $3500 can set resistance so well in gold, similar to how the $2k level was resistance in the metal for three and a half years until last year’s breakout finally took over. Simply, human beings tend to think in these simplified round numbers and as such a test above $3500, even if only by one cent, can make the market ‘feel’ more expensive than just two cents above $3499.99.
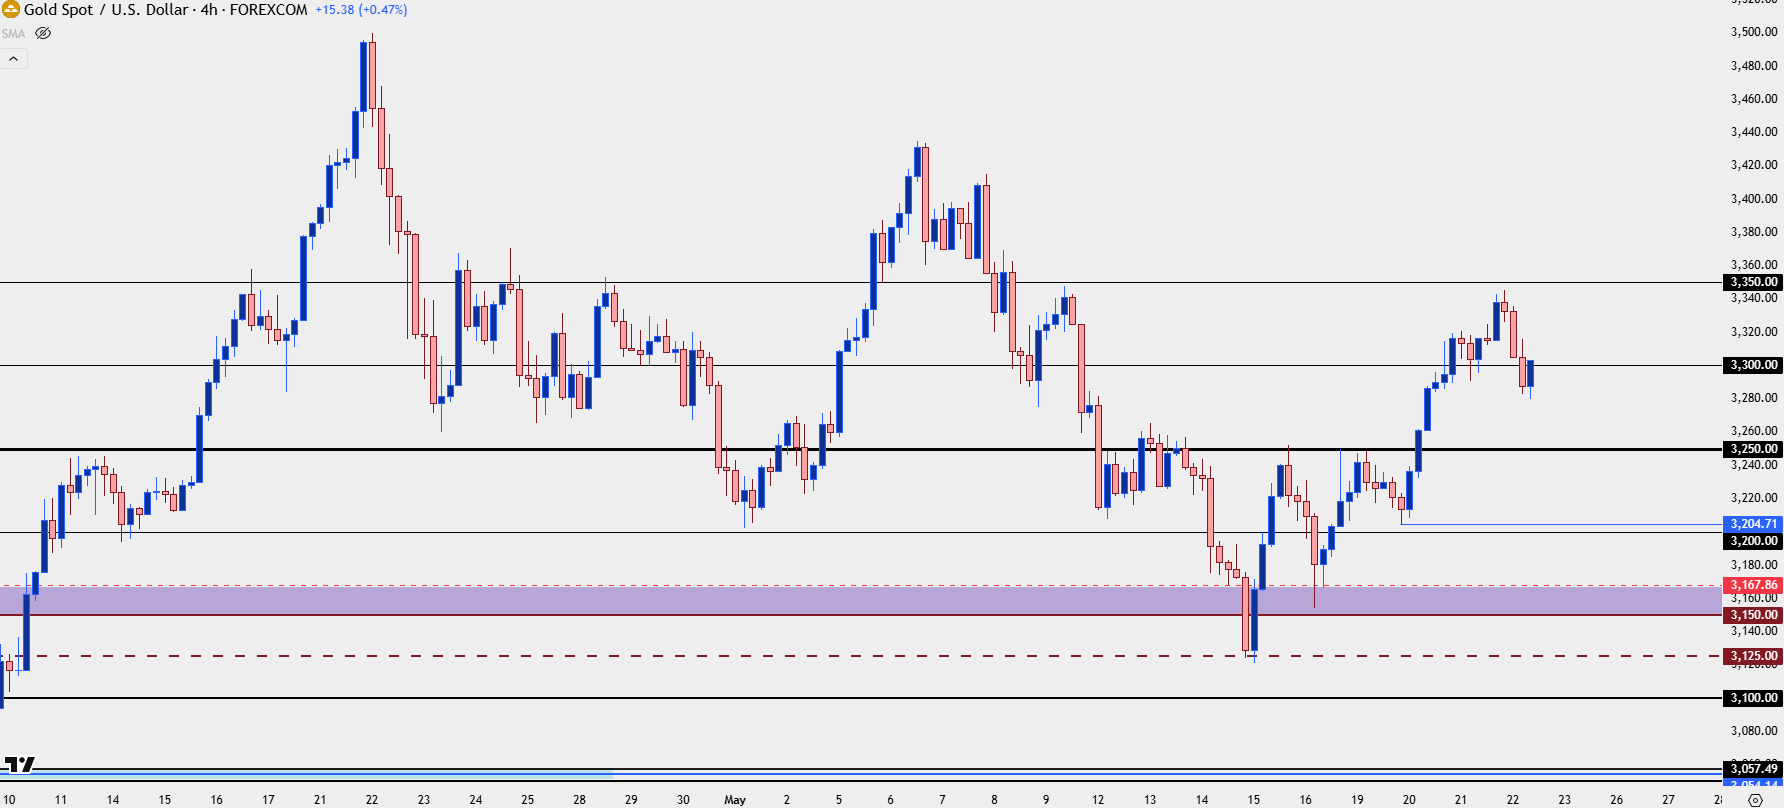
It can also lend to profit taking, for those that had bout just weeks earlier at $3200 or lower, they know have price testing a major big figure that might unsettle the trend, which can open the door to an attractive time to take profits on the move, thereby leading to supply and thusly, lower prices. This dynamic can show on several time frames and it was in-play last Friday when I looked at the shorter-term setup in gold during the webinar, as $3250 had held resistance.
At the time, there was also a zone of support potential as taken from prior resistance, spanning from around $3150 up to $3167. This was simply a grouping of swing highs from late-March and early-April, and while that zone could not hold support earlier in the week, it was showing as support on Friday morning after the pullback from $3250. The next push up to $3250 didn’t break through either, but the third one did and that’s what led to the rally earlier this week.
At this point, the $3350 level still hasn’t been taken out by bulls and as we can see from the weekly chart above, that’s been a big level, so it’ll be a notable event for the trend when or if it finally is traded through on a weekly close basis.
For now, I want to continue to bias gold as bullish given the larger backdrop and trend, and that $3250 level is now a spot of support potential if the current pullback can run for a bit longer.
Gold Four-Hour Price Chart
 Chart prepared by James Stanley; data derived from Tradingview
--- written by James Stanley, Senior Strategist


