

Gold Futures (GC) Technical Analysis
It seems far more likely than not that gold will go on to print new highs this year, given the strength of its bullish trend and supporting fundamentals. However, it appears to be undergoing a much-needed correction — potentially a welcome opportunity for sidelined bulls waiting to reload at more favourable prices.
Gold Futures (GC): Monthly Chart
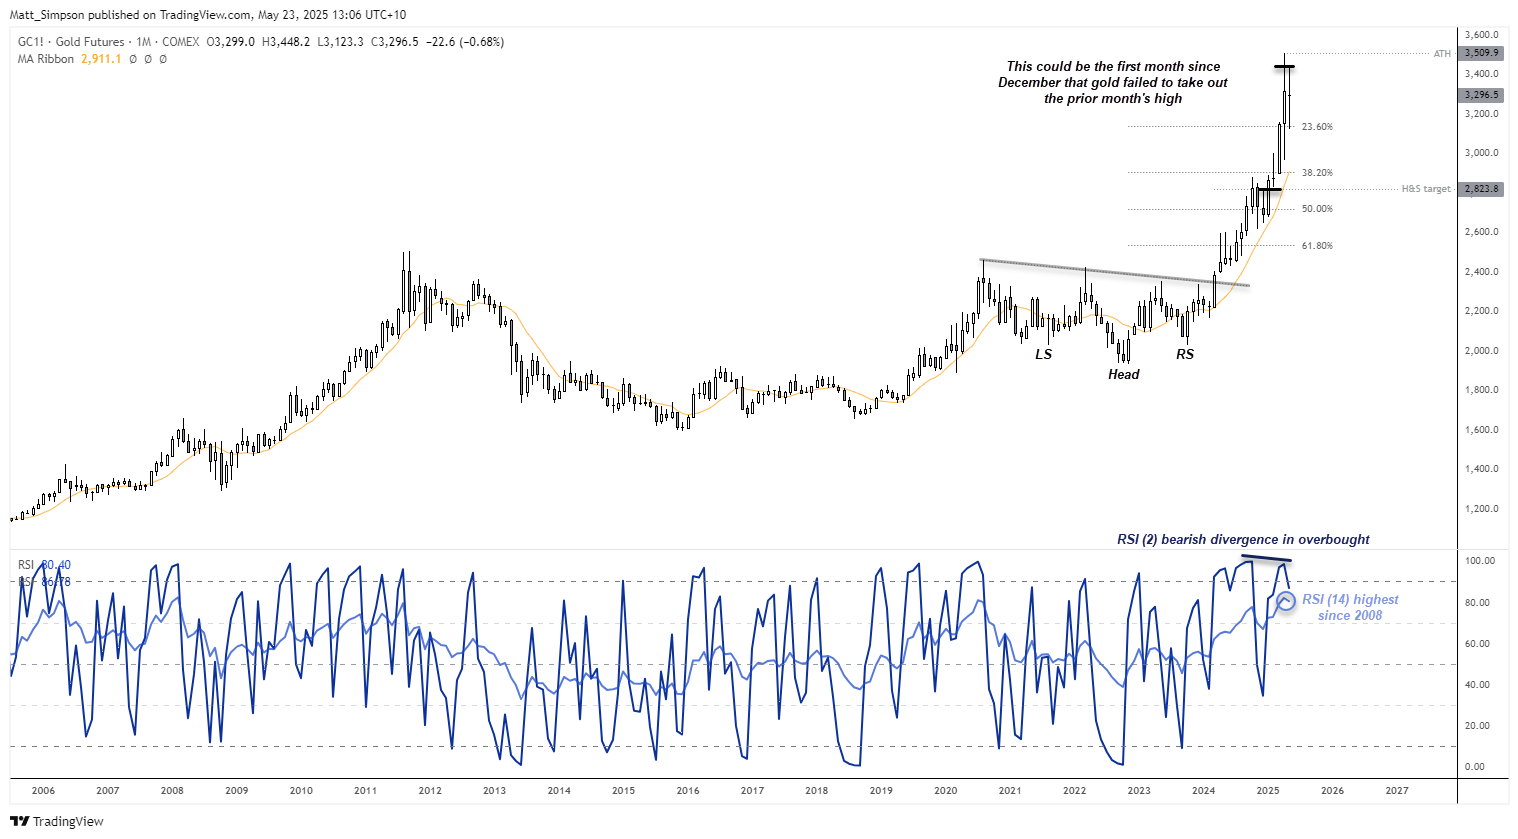
Gold’s parabolic trend began in March 2024, following a breakout from an inverted head and shoulders (H&S) pattern that reached its projected upside target of ~2800 within seven months. After a two-month retracement, bulls regained control, driving prices as high as 3500.
However, it now seems likely that gold will fail to take out the previous month’s high for the first time this year. With just one week of the month remaining, gold is currently on track to print a spinning top doji, having met resistance around 3400 — just beneath its all-time high (ATH).
The monthly RSI (14) remains extremely overbought, while a bearish divergence has formed in the oversold zone of the RSI (2).
Support has been found around the 23.6% Fibonacci ratio ~3140, though a break beneath it opens up a run for the 38.2% fib level near the 10-month SMA and 2900 handle.

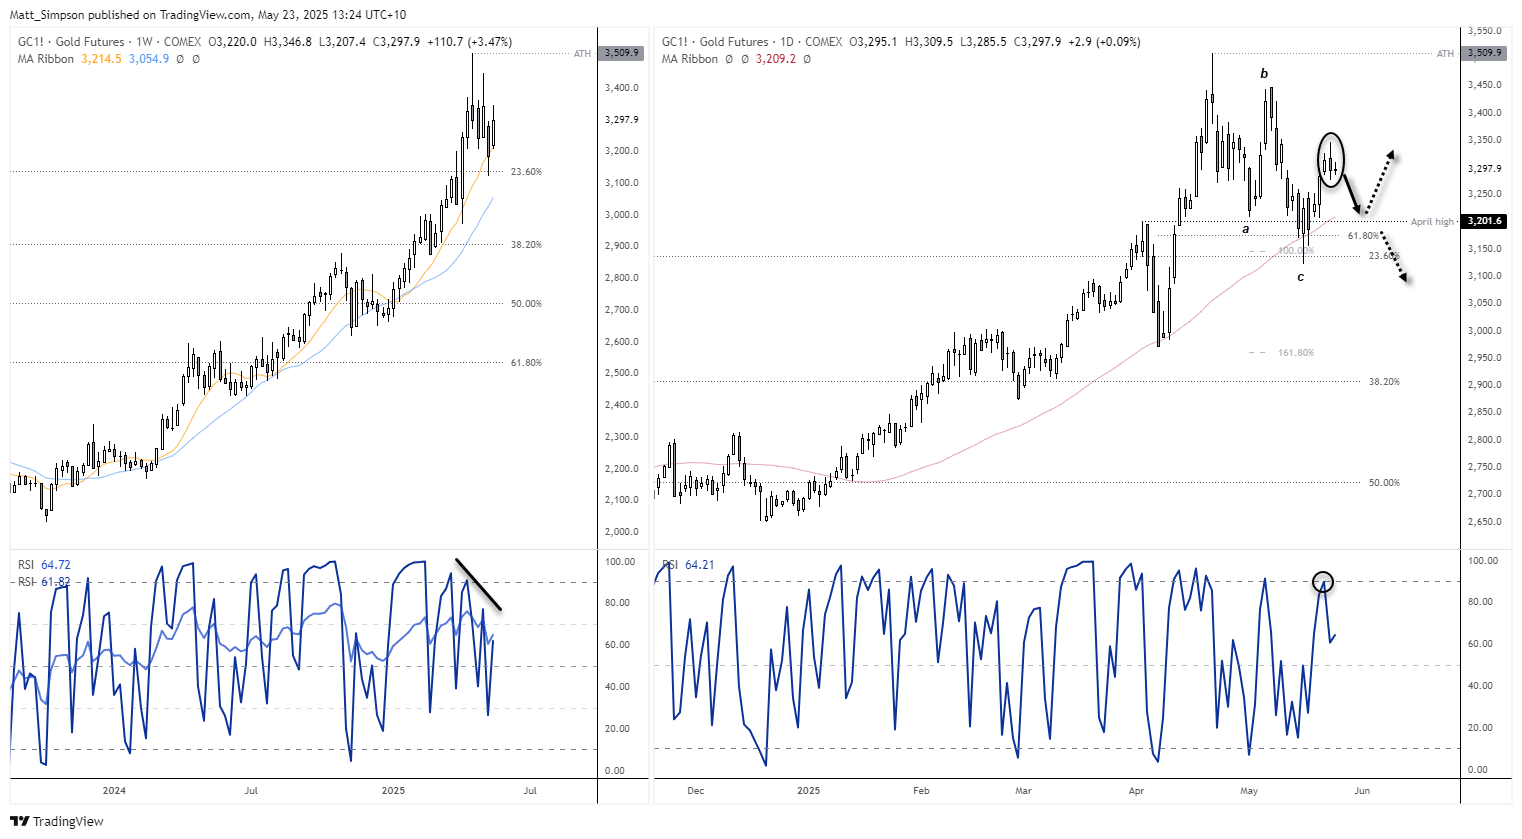
Gold Futures (GC): Weekly and Daily Chart
Time will tell whether the monthly timeframe is in for a deeper pullback. For now, we can hone in on the weekly and daily charts for a potential near-term setup.
Choppier price action is already apparent on the weekly chart and has been accompanied by a bearish divergence on the RSI (2).
The daily chart shows that gold has completed the ABC correction I suggested earlier in May. The end of wave C found support near the long-term 23.6% Fibonacci retracement and the 100% projection of wave A to B. The recent closing lows also held above a smaller 61.8% Fibonacci level, suggesting that gold may not be ready to break beneath the 3180 level — at least for now.
However, a bearish outside day formed on Thursday, with the RSI (2) rising to 89.7 — nearing the typical overbought threshold of 90. This hints that a pullback toward the 50-day SMA around the 3200 handle could be on the cards in the near term.
If such a pullback occurs, how prices react around the 3180–3200 zone could offer better insight into whether the ABC correction is indeed complete (and a rally to new highs is likely), or if a deeper pullback is still yet to unfold.
-- Written by Matt Simpson
Follow Matt on Twitter @cLeverEdge
Latest market news
September 18, 2025 02:48 PM
June 23, 2025 01:22 PM
June 23, 2025 10:39 AM
June 20, 2025 05:23 PM
June 20, 2025 04:46 PM
June 20, 2025 03:35 PM

June 9, 2025 09:32 AM

May 12, 2025 06:44 AM
April 27, 2025 02:00 PM