

It always feels like markets get more exciting whenever I take time off—and this time has been no exception. During my one-week hiatus, Moody’s stripped the US of its AAA credit rating, and Congress is preparing to vote on a sweeping tax bill projected to add $3 trillion to the national debt—sparking a surge in bond yields and a selloff on Wall Street.
The question now is whether the bond market will pressure central banks into action. Perhaps the Bank of Japan (BOJ) will be forced to intervene in its bond market, which could reduce the appeal of the yen as a safe haven. Or the BOJ might become more vocal on the exchange rate—typically the cheaper and quicker option.
Meanwhile, Trump’s tax bill faces resistance, and if it gets blocked, we could see Wall Street’s risk-on rally rekindle. But as it stands, sentiment has soured and appears at risk of fully rolling over, unless policymakers step in soon.
View related analysis:
- AUD/USD Outlook: Australian Dollar and Chinese Yuan Rally, But Gains May Stall
- Nasdaq 100 Breaks Out Into Bull Market, Tops Wall Street Rally
- USD/JPY, USD/CAD, AUD/USD Outlook: US Dollar Rallies on Tariff Pause
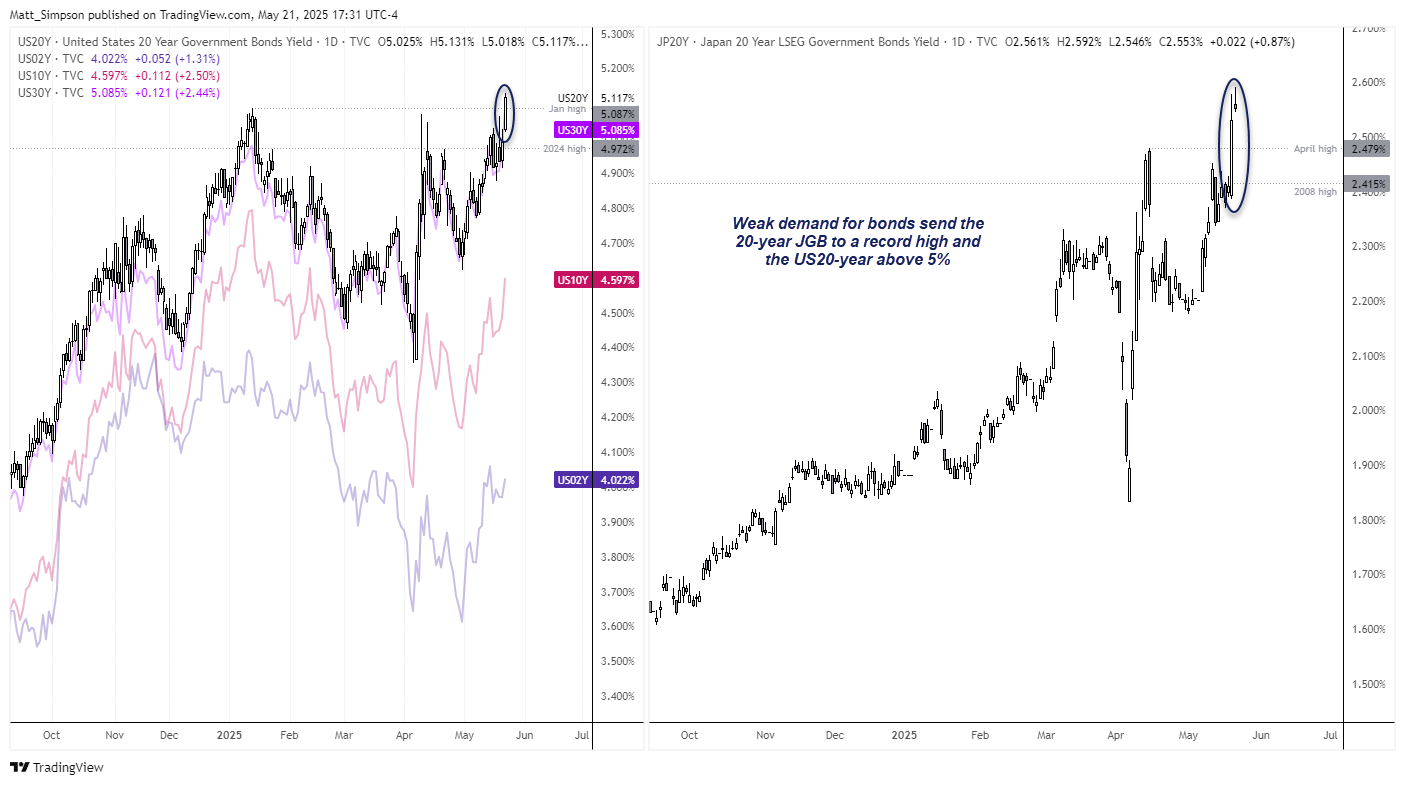
Yields surge as Bond Auctions Reveal Structural Weakness
Japan’s 20-year JGB surged to a record high this week following notable weak demand at the bond auction, and the widest bid to cover ratio in four decades. The BOJ are already tapering their bond purchases, which suggests structural demand weakness from traditional buyers such as pension funds and insurance companies.
Then on Wednesday we saw a notably weak bond auction for the US 20-year treasury, with investors wary of higher inflation expectations, high-for-longer Fed policy and renews concerns over deficit spending.

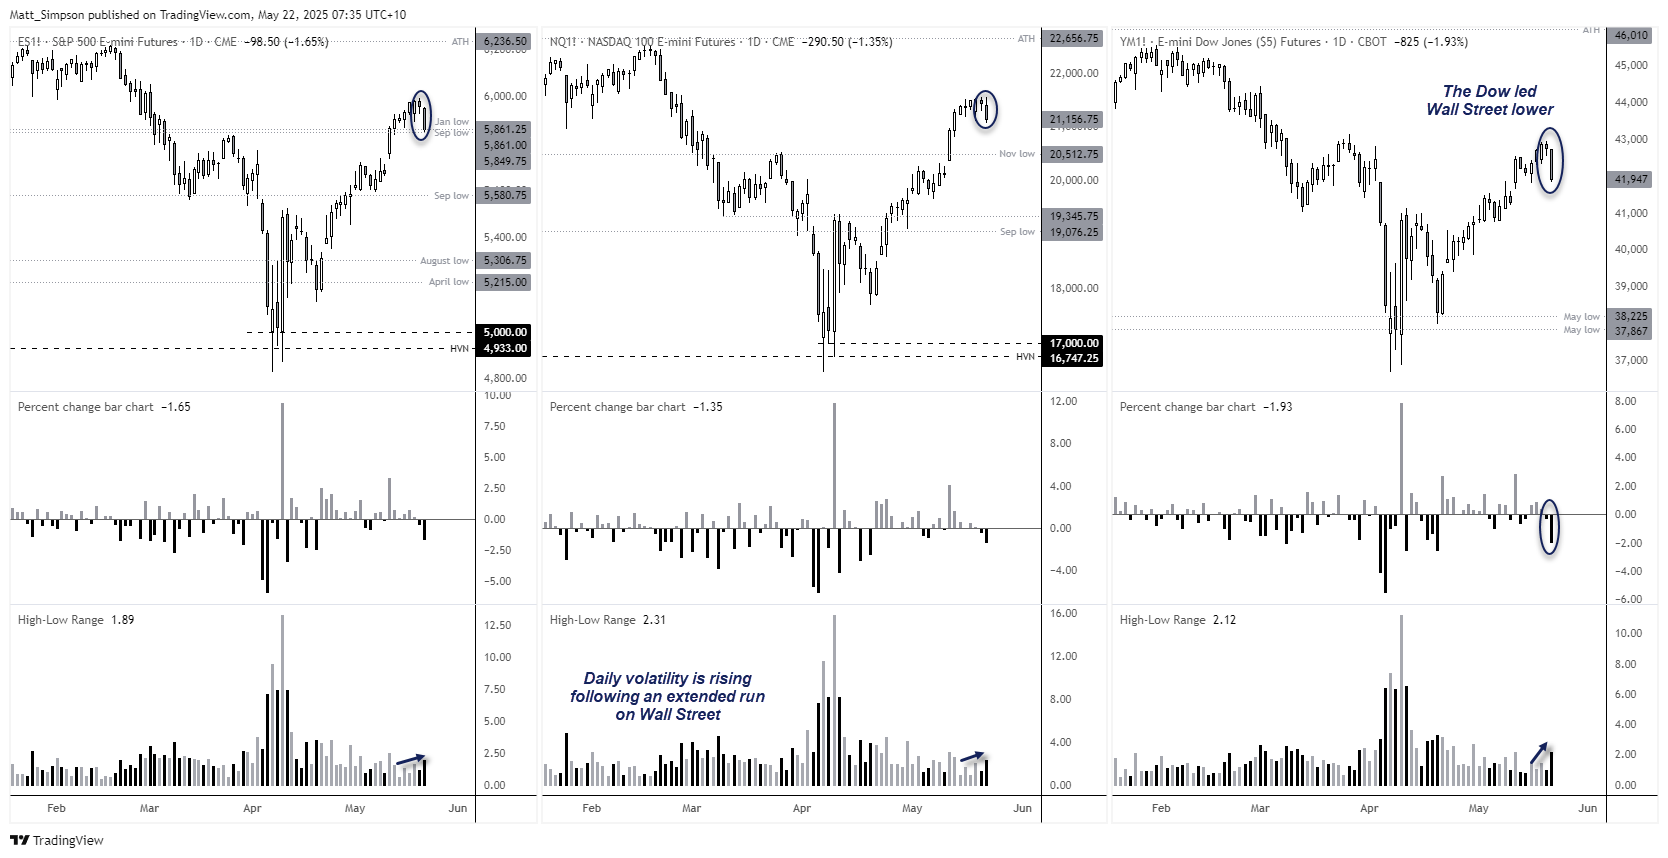
Dow Jones (DJIA) Lead Wall Street Lower, VIX perks up
The surge in yields prompted Wall Street traders to take notice, sending Dow Jones futures down 2.1% and below the 42,000 mark. This pullback makes sense, given the Dow had posted the weakest rally from the April low—just 17%—compared to 24% for the S&P 500 and 31% for the Nasdaq 100.
S&P 500 futures fell 1.7%, though they found support around the September and January lows—a shame, as the index was within half a percent of entering a ‘technical bull market’. Nasdaq 100 futures dropped 7.1%, which also aligns with expectations, given it had been the clear outperformer during the run-up.
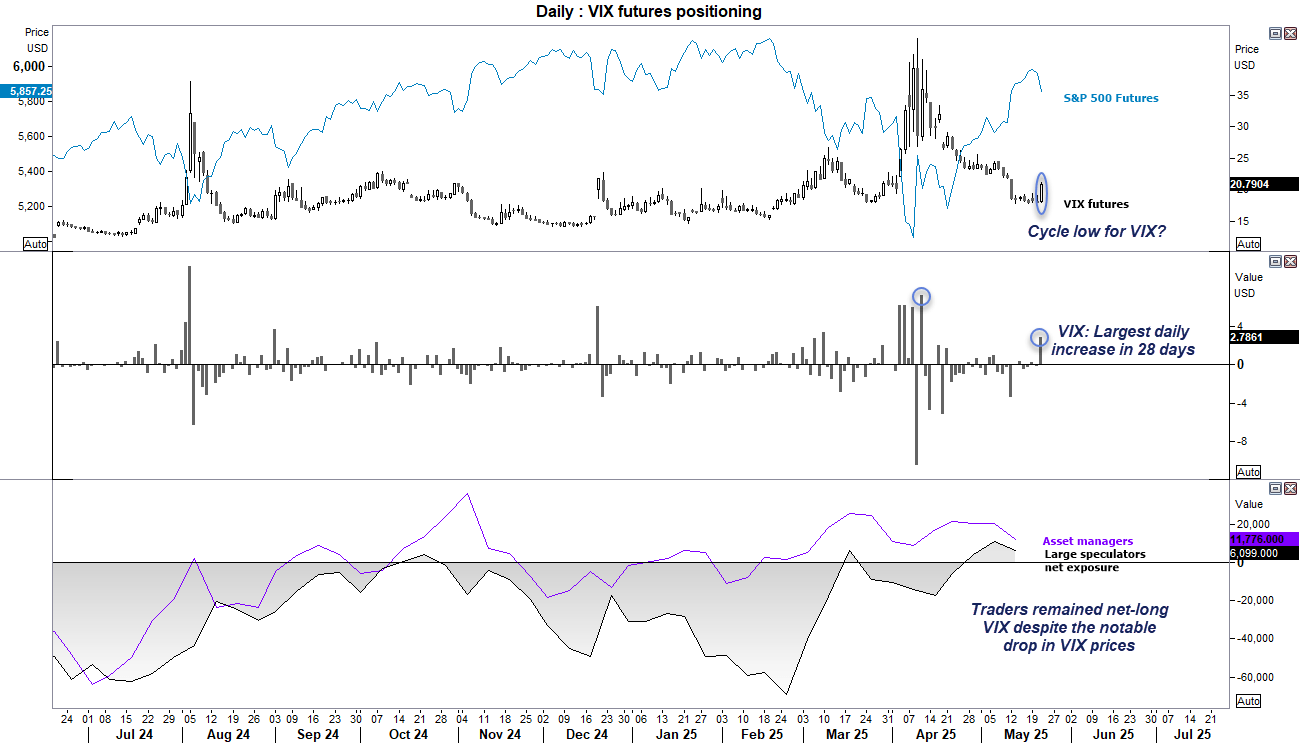
Volatility Index Positioning (VIX): Weekly COT Report Analysis
Recent data from the COT report shows that asset managers and large speculators remained net-long VIX futures last week. While net-long exposure has actually diminished for the last two weeks, it is worth noting that traders remain net-long VIX futures despite prices falling quite considerably from the cycle high.
And that begs the question as to whether we have seen an important swing low on the VIX. If so, it suggests Wall Street rally was nothing more than a nasty bear-market bounce, which could bode well for Japanese yen bulls.

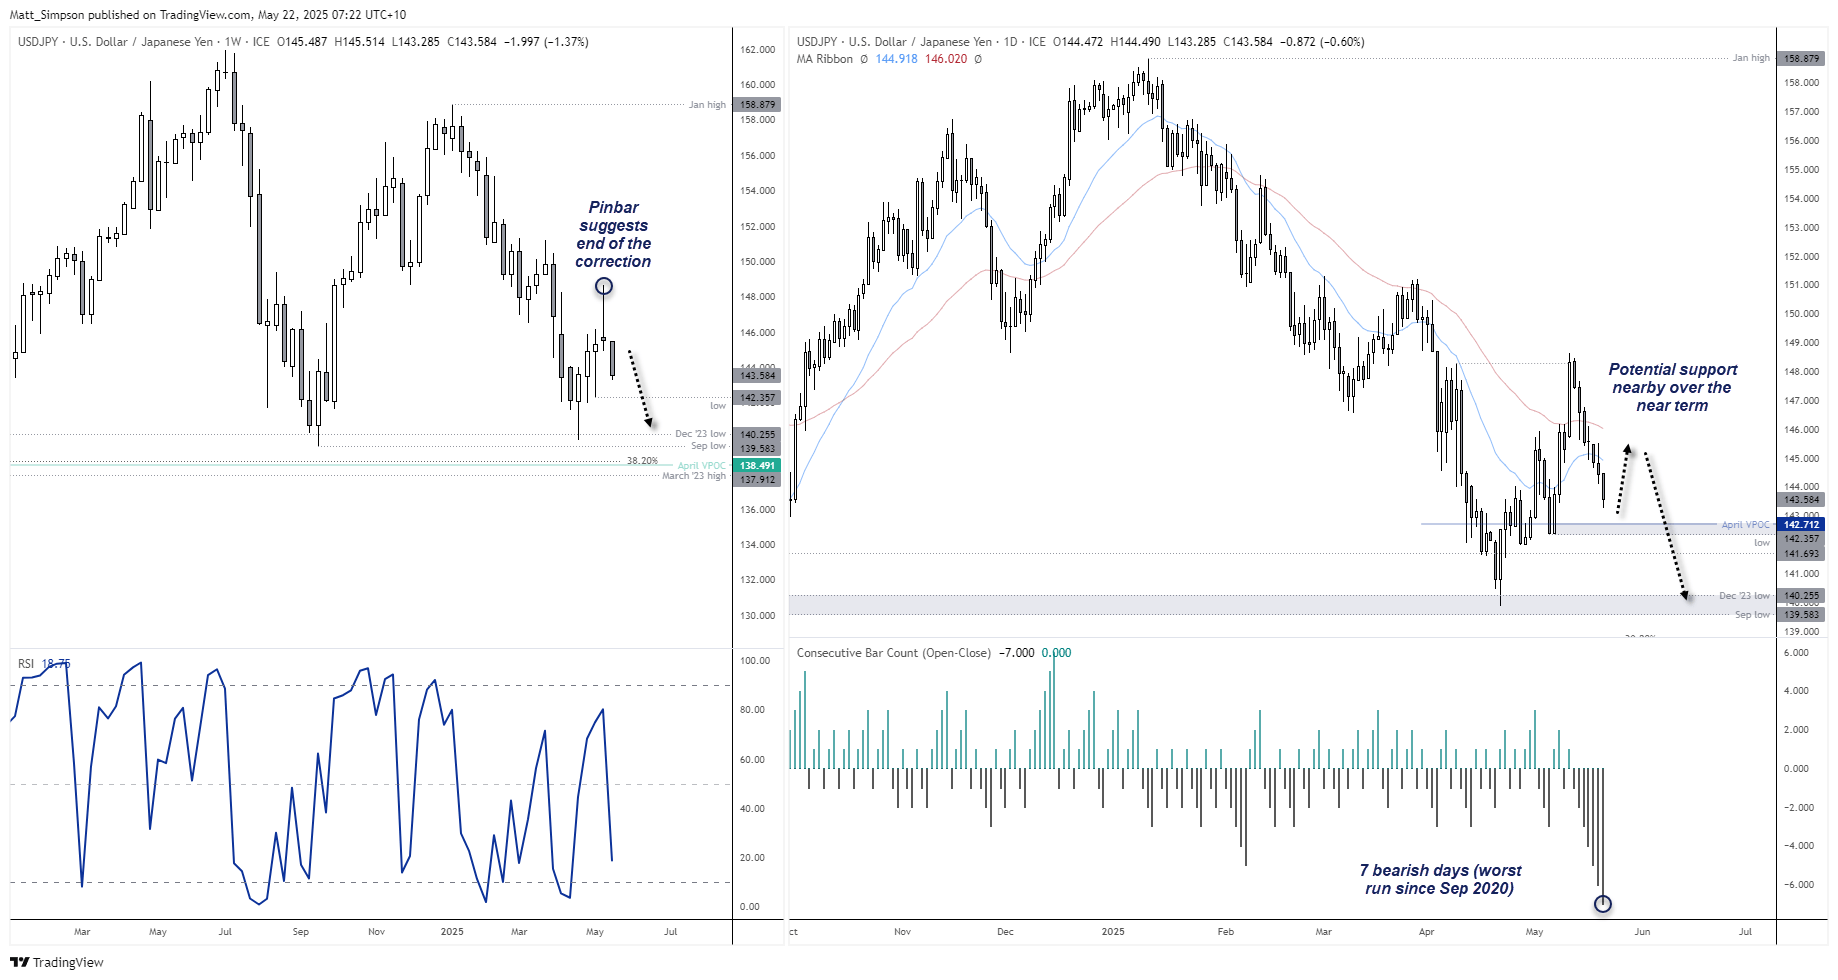
USD/JPY Technical Analysis: US Dollar vs Japanese Yen
The weekly chart shows a bearish pinbar snapped the 3-week rebound on USD/JPY, which suggests its correction is complete. USD/JPY bears will no doubt be relishing the potential for a break below 140.
However, USD/JPY has also just printed its seventh consecutive bearish candle, its strongest such streak since September 2020. While that doesn’t overpower fundamentals, it is a warning sign that the current move lower may be due to at least a minor bounce.
Also note that the April VPOC at 142.72 and May low at 142.36 nearby, so I would look for any signs of sup144.91) and 50-day EMA (port around this area. Should we see such a bounce, bulls could seek moves towards the 20-day EMA (146).
Beyond that, the bias is for at least a retest of 140.
-- Written by Matt Simpson
Follow Matt on Twitter @cLeverEdge
Latest market news
September 18, 2025 02:48 PM
June 23, 2025 01:22 PM
June 23, 2025 10:39 AM
June 20, 2025 05:23 PM
June 20, 2025 04:46 PM
June 20, 2025 03:35 PM

June 18, 2025 07:38 PM

June 18, 2025 03:24 PM
June 16, 2025 03:30 PM

June 12, 2025 04:08 PM