

Japanese Yen Technical Forecast: USD/JPY Weekly Trade Levels
- USD/JPY plunges 4.4% off May highs- price coiled above multi-year trend support
- USD/JPY range breakout imminent- U.S. Consumer Price Index on tap
- Resistance 145.63-146.15 (key), 148.65, ~150.08- Support 143.68, 139.58-140.49 (key), 136.51-137.24
The Japanese Yen is virtually unchanged since the start of the week with USD/JPY holding a tight range just above critical support into the open of June. Battle lines drawn on the USD/JPY weekly technical chart ahead of U.S. CPI.
Review my latest Weekly Strategy Webinar for an in-depth breakdown of this Yen setup and more. Join live on Monday’s at 8:30am EST.Japanese Yen Price Chart – USD/JPY Weekly
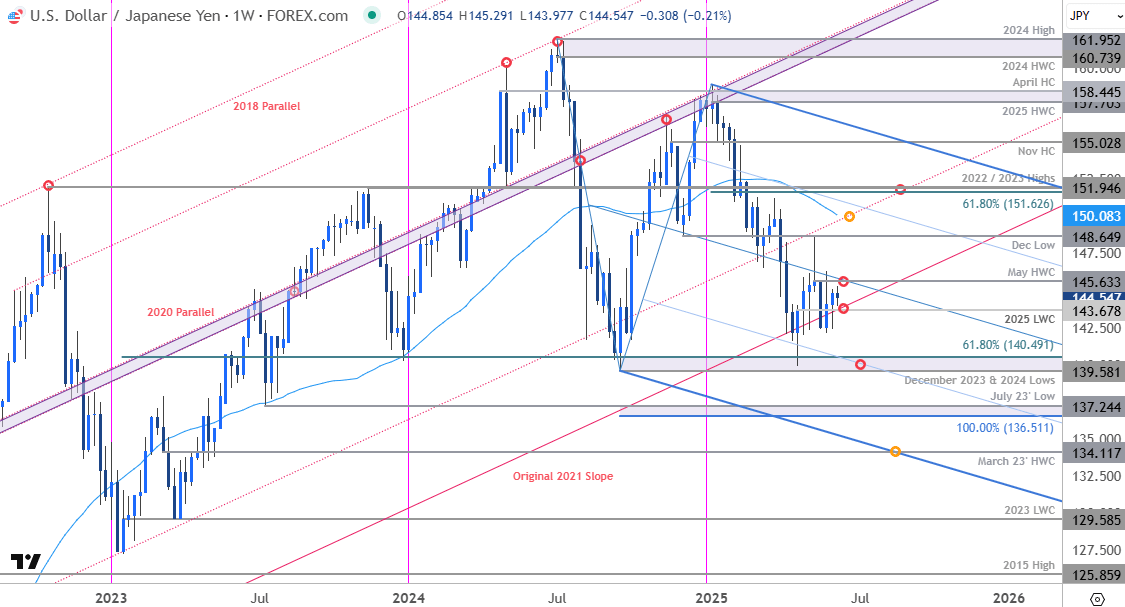
Chart Prepared by Michael Boutros, Sr. Technical Strategist; USD/JPY on TradingView
Technical Outlook: In last month’s Japanese Yen Technical Forecast we noted that USD/JPY was, “attempting to mount a key technical confluence, and the focus is on the weekly close with respect to 147.14. From a trading standpoint, a good zone to reduce portions of long-exposure / raise protective stops – losses should be limited to the weekly-open IF price is heading higher on this stretch..” Price failed to close above the median-line that week with USD/JPY plunging 4.4% into the close of May. The bears have been unable to break the 2021 original slope line, and the immediate focus is on a breakout of near-term range above support.
Initial weekly resistance is now eyed with the May high-week close (HWC) / 61.8% retracement of the May decline at 145.63-146.15- a breach / weekly close above this level would be needed to suggest a larger rebound is underway. Subsequent resistance objectives eyed at the December low / May high at 148.65 and the 52-week moving average (currently ~150.08). Ultimately a weekly close above the 61.8% retracement of the yearly range / 2022 & 2023 highs at 151.62/95 would be needed o threaten resumption of the broader multi-year uptrend in USD/JPY.
Weekly support rests with the yearly low-week close (LWC) at 143.68 with a close below the 2021 slope needed to fuel another run at key support (multi-year bullish invalidation) at the yearly lows near 139.58-140.49- a region defined by the December 2023 & 2024 lows and the 61.8% retracement of the 2023 advance. Look for a larger reaction there IF reached. Subsequent support objective seen at the 100% extension of the 2024 decline / July 2023 swing low around 136.51-137.24.

Bottom line: USD/JPY is trading just above multi-year uptrend support with a tight-range in view early in the month. From a trading standpoint, the immediate focus is on a breakout of the 143.68-146.15 range for guidance here with the yearly downtrend vulnerable while above the 2021 trendline. Look for the breakout in the days ahead.
Keep in mind we get the release of key inflation data tomorrow with the U.S. CPI on tap. Stay nimble into the release and watch the weekly close for guidance. Review my latest Japanese Yen Short-term Outlook for a closer look at the near-term USD/JPY technical trade levels.
USD/JPY Key Economic Data Releases
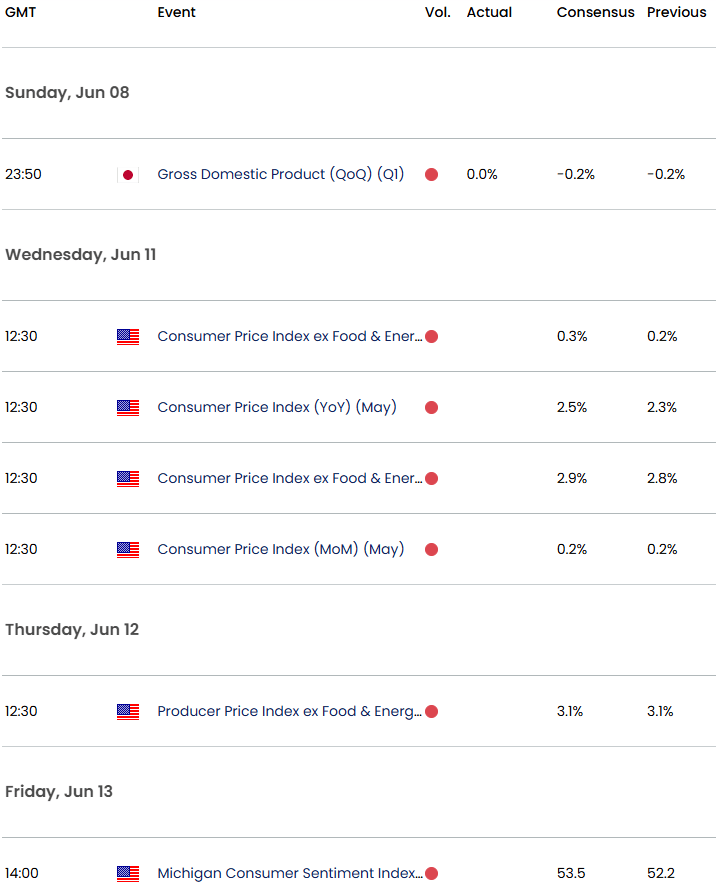
Economic Calendar - latest economic developments and upcoming event risk.
Active Weekly Technical Charts
- Australian Dollar (AUD/USD)
- US Dollar Index (DXY)
- British Pound (GBP/USD)
- Swiss Franc (USD/CHF)
- Euro (EUR/USD)
- Canadian Dollar (USD/CAD)
- Gold (XAU/USD)
--- Written by Michael Boutros, Sr Technical Strategist
Follow Michael on X @MBForex
Latest market news
September 18, 2025 02:48 PM
June 23, 2025 01:22 PM
June 23, 2025 10:39 AM
June 20, 2025 05:23 PM
June 20, 2025 04:46 PM
June 20, 2025 03:35 PM

June 17, 2025 02:00 PM

June 12, 2025 06:08 AM

May 28, 2025 11:01 AM

May 22, 2025 11:14 AM