

Japanese Yen Talking Points:
- USD/JPY tested the 140.00 level briefly earlier this week, and that was the same price that helped to set the low last year.
- The bounce from that test is still ongoing, and for bears it’s the 145.00 level that stands out as a point of interest for lower-high resistance as taken from prior support.
- EUR/JPY may be more attractive for Yen-strength as a major spot of resistance remains in-play, and GBP/JPY more attractive for Yen-weakness at the moment given a build of bullish price action on the daily following a breakout from an ascending triangle formation.
USD/JPY continues to brew bear traps and this week’s test of the 140.00 handle was no different, as it has so far led to a strong snap back of a move that’s been pretty persistent for most of the year. The backdrop bears similarity to last Q3 when that price had previously come into play, as a slow bleed in the USD driven by carry unwind drove both the USD and USD/JPY lower.
In that prior instance, the 140 test showed just a couple of days ahead of the FOMC’s first rate cut of the cycle, with a higher-low printing on the day of the meeting. And then it was a couple weeks later when the USD Q4 reversal took over and USD/JPY went along with it.
It’s difficult to forecast such reversals so traders should remain cautious, but for those that do want to look at short-side USD/JPY scenarios, it’s the 145.00 level that stands out as an area of interest as this was a spot of support from earlier April that hasn’t yet shown as resistance.

USD/JPY Daily Price Chart
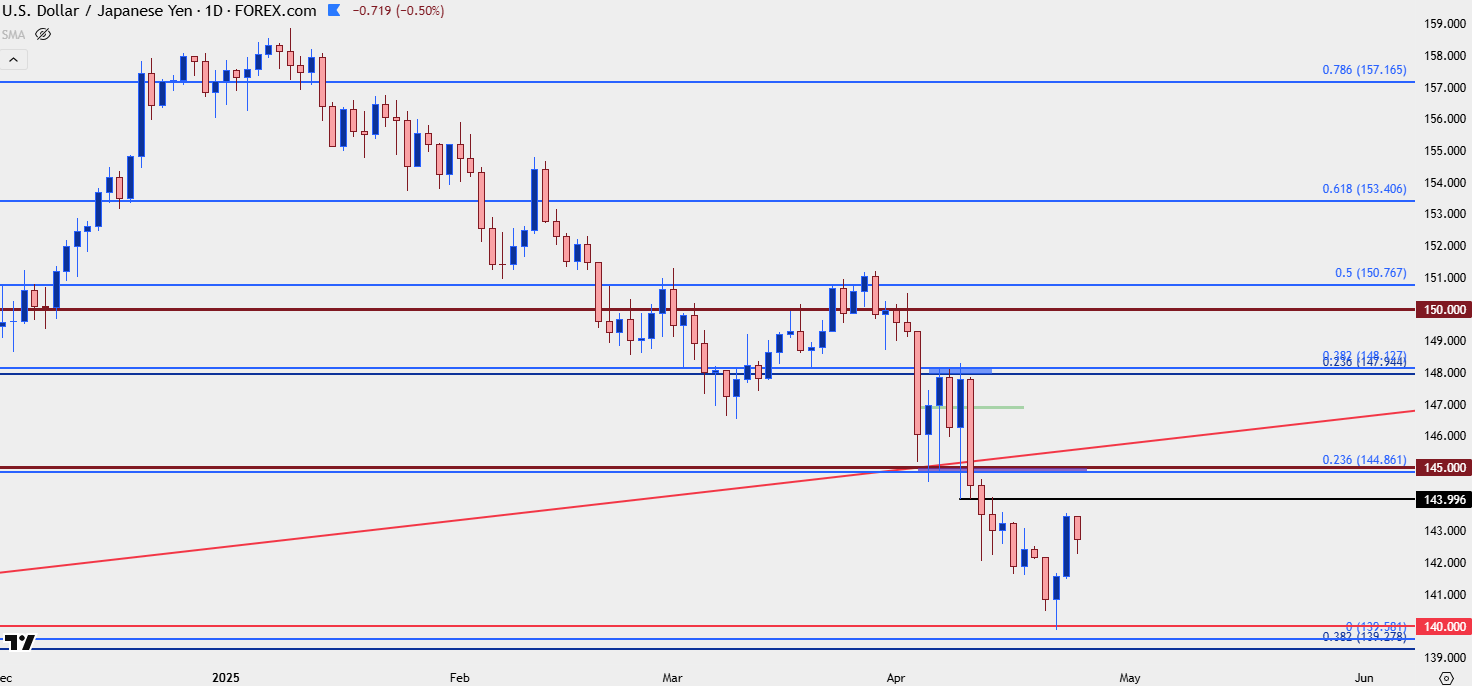 Chart prepared by James Stanley; data derived from Tradingview
EUR/JPY
For those that are looking for Yen-strength, there could be a case to be made from the technical backdrop in EUR/JPY. The pair remains very close to the same resistance zone that’s held the highs for the past five weeks. And bigger picture, there’s a descending triangle here given the horizontal support around 155.00 and the lower-highs since November.
The next support test would be around the 160.00 handle which has similarly put up some fight as it helped to hold the lows earlier in April and notably, there hasn’t been a daily close below that price since March 11th.
EUR/JPY Weekly Price Chart
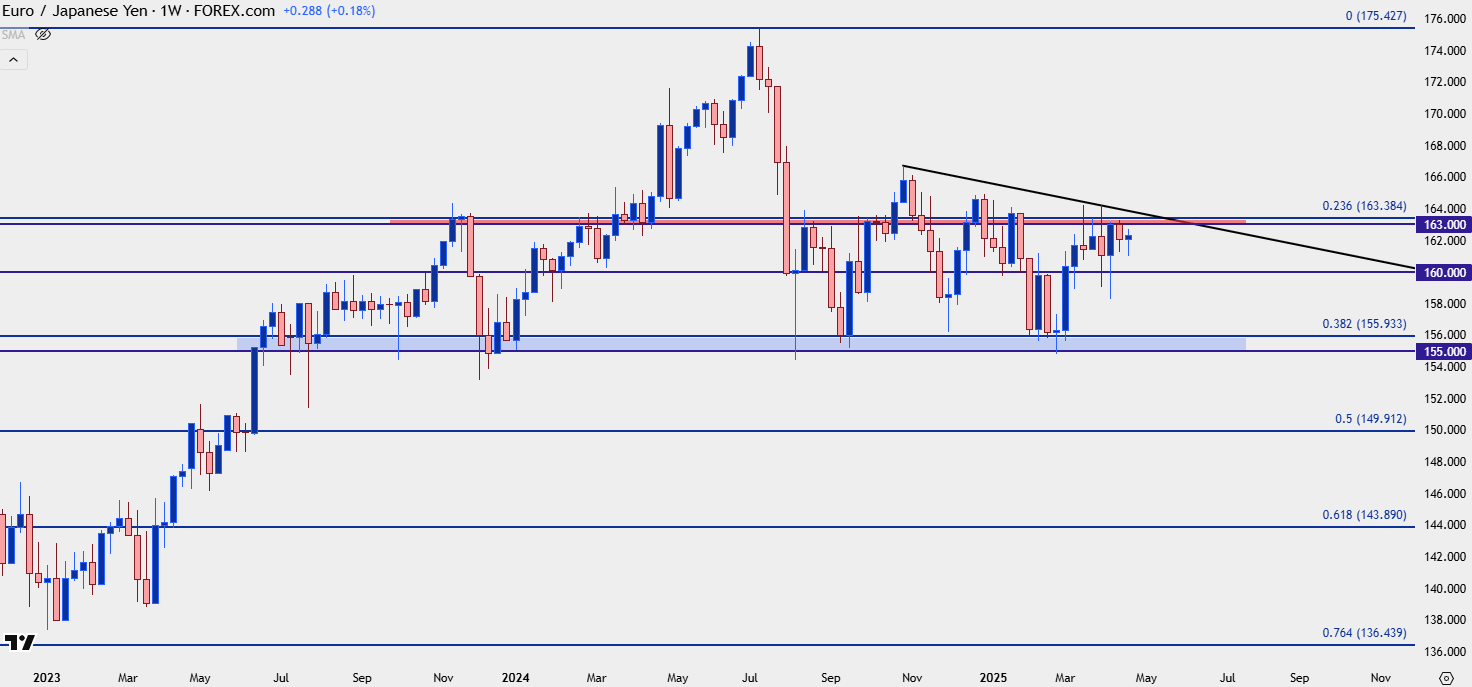 Chart prepared by James Stanley; data derived from Tradingview
GBP/JPY
In GBP/JPY, the same long-term zone from 2008 continues to loom large and this runs from 193.61 up to 198.08. This area has been in play for 12 of the past 14 months, and from the monthly chart below there’s a possible topping scenario playing out as sellers have been pushing a pattern of lower lows and lower highs over the past seven months.
GBP/JPY Monthly Chart
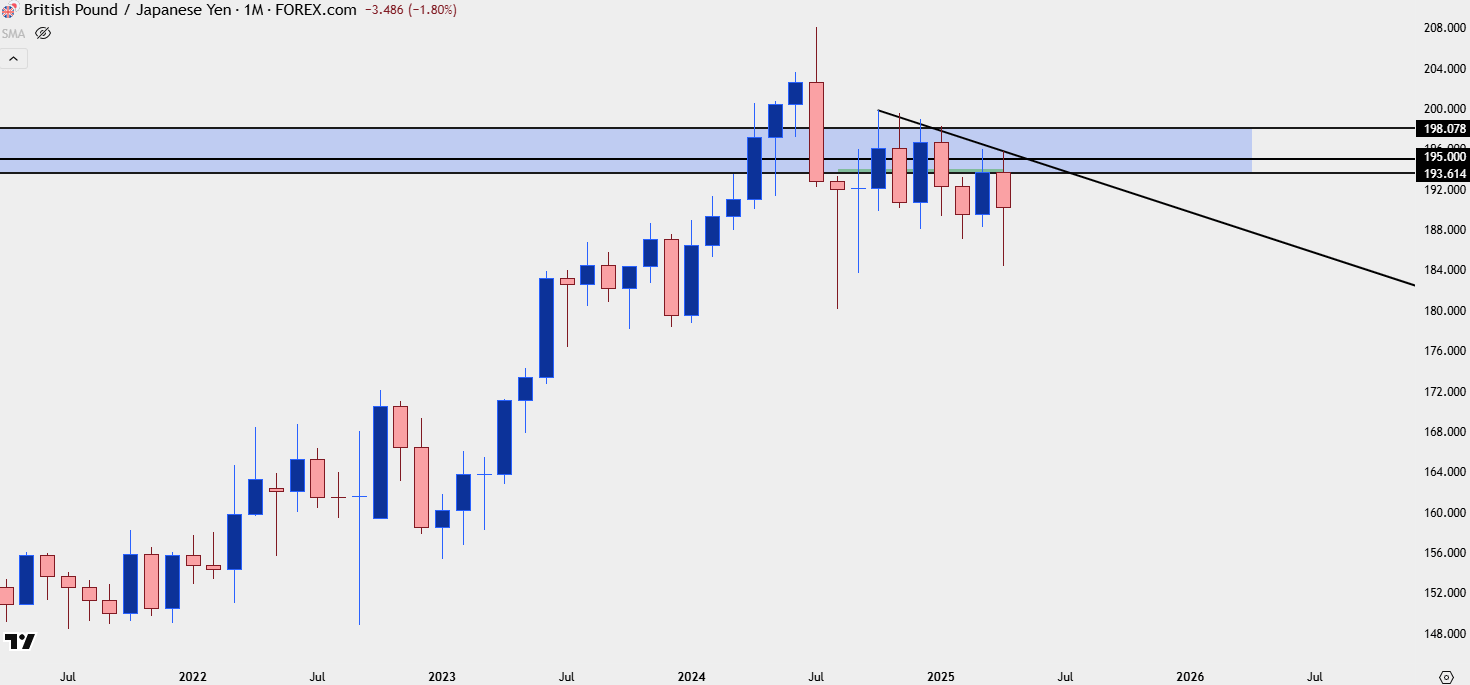 Chart prepared by James Stanley; data derived from Tradingview
From the underside wick on the monthly chart, we can see where bears had their chance earlier in April but were unable to capitalize. And the daily chart echoes that, as it shows a series of higher-lows over the past few weeks which, when synced with resistance at 189.52, makes for an ascending triangle pattern.
Bulls have forced a breakout from that pattern over the past two days and prices are now back above the 190.00 handle. This can set the stage for support defense in the 189.52-190.00 area of the chart.
GBP/JPY Daily Price Chart
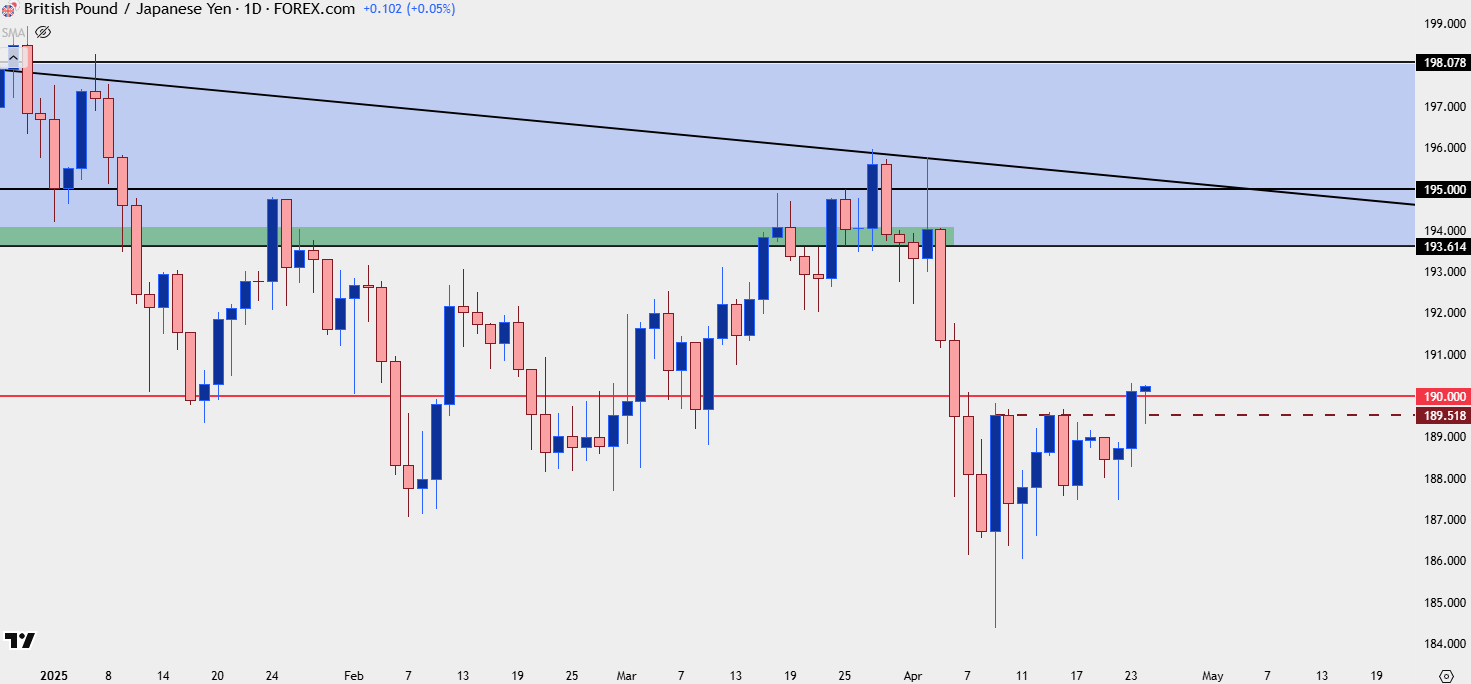 Chart prepared by James Stanley; data derived from Tradingview
--- written by James Stanley, Senior Strategist
Latest market news
September 18, 2025 02:48 PM
June 23, 2025 01:22 PM
June 23, 2025 10:39 AM
June 20, 2025 05:23 PM
June 20, 2025 04:46 PM
June 20, 2025 03:35 PM

June 20, 2025 05:23 PM

June 20, 2025 12:21 PM

June 20, 2025 05:20 AM

June 20, 2025 12:39 AM