

Japanese Yen Talking Points:
- USD/JPY is trying to break its streak of seven consecutive red days, following the failed breakout at the 148.00 handle.
- While larger carry unwind potential remains for USD/JPY, which could have repercussions across global risk markets, the 140.00 level remains a major spot and until there’s cleaner trend in the major pair, EUR/JPY could be more compelling for JPY-strength and GBP/JPY for Yen-weakness.
- I look into all three pairs during each webinar, and you’re welcome to join the next. Click here to register.
USD/JPY started last week with a notable breakout, rushing through the 148.00 level as the USD breakout took greater hold. But then that’s right around when matters began to melt down for bulls, and since then, it’s been seven consecutive red bars on the daily chart as that move has pared back.
The jump in Japanese bond yields has likely had something to do with it, and this raises questions of larger breakdown potential, which could carry with it large repercussions across global macro markets.
Japanese 40-Year Bond Yields Spiking Higher
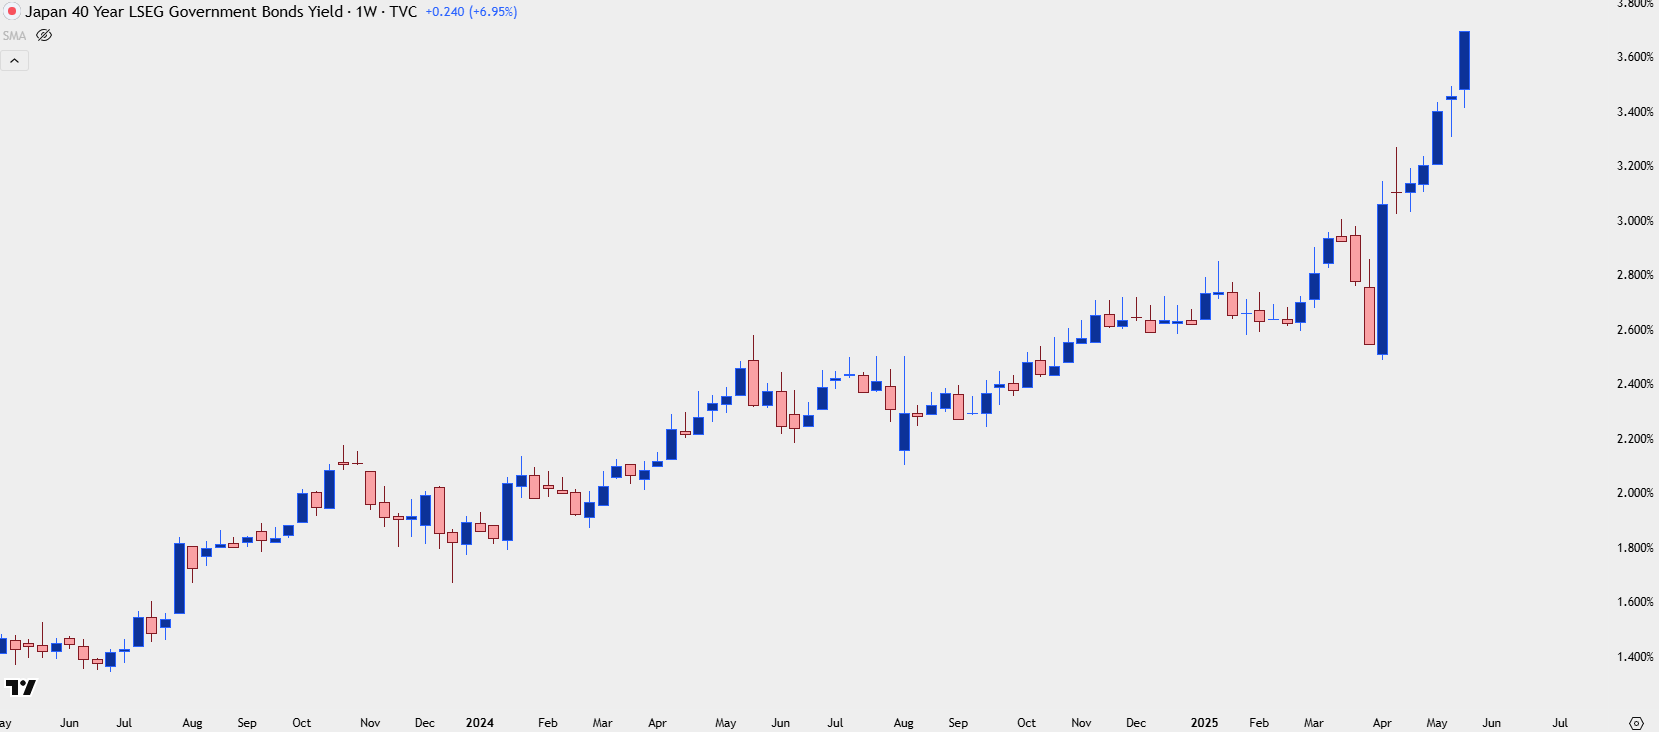 Chart prepared by James Stanley; data derived from Tradingview
When carry unwind took over last year in Q3, it brought a notable sell-off in global equities. And given the fact that the carry trade is essentially a form of leverage, where institutional investors can get loans in Japan at very low rates while rates elsewhere lift, it makes sense that many would look to capitalize on the opportunity.
The problem at that point is that if getting a loan from a Japanese bank in Yen, there’s now currency risk and if Yen-weakness continues that could erase any benefit of playing the spread. So, that can lead to hedging via the long side of USD/JPY as institutions look to shield against that risk.
As long as the rate divergence remains there could be limited problems. But as the trade gets more and more crowded, the backdrop becomes more and more prone to counter-trend scenarios, similar to what showed in Q4 of 2022 and 2023.
Last July, however, there was legitimate fear of the trade coming undone. U.S. rates were expected to start cutting and Japanese rates were moving higher on the back of higher Japanese inflation. As you can see from the long-term yields above, the trend was for bond yields in Japan to push more and more and this narrowed the spread between Japanese rates and the rest of the world.
As those carry trades unwound, so did USD/JPY, and the pair dropped precipitously from July highs above 160.00 to September lows at 140.00. That same level came into play in late-April and that’s what helped to prod a pullback in both USD/JPY and U.S. Dollar markets.
USD/JPY Weekly Price Chart
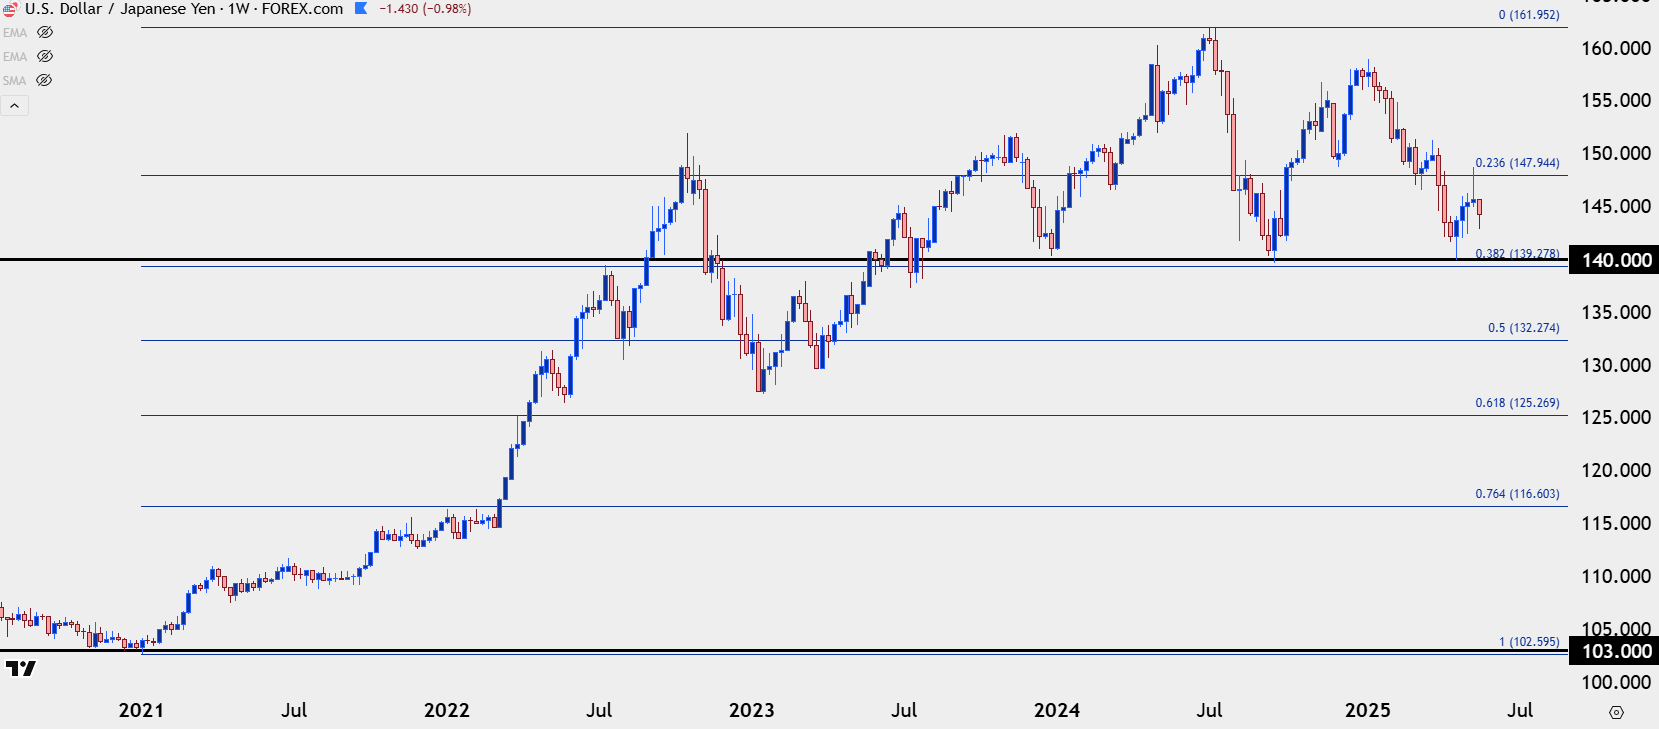 Chart prepared by James Stanley; data derived from Tradingview

USD/JPY Near-Term
Getting back to current matters, given the rise in Japanese yields and the seven-day sell-off in USD/JPY, it would seem a possibility for larger carry unwind themes to take back over again. But, it would be remiss to assume that outcome at this stage given the two rigid holds of 140.00 that have shown over the past year. And as I said in the video linked above, if looking for Yen-strength, I still think there’s a more amenable pasture elsewhere in EUR/JPY at the moment. And for Yen-weakness, I think GBP/JPY has a more attractive backdrop currently.
In USD/JPY, bulls look to be vying to break the streak, and this exposes the 145.00 level as a major spot of contention after which 145.92 comes into play. If bulls can force a break above that price, it’ll look like another short-term trend coming to order for USD/JPY.
USD/JPY Daily Price Chart
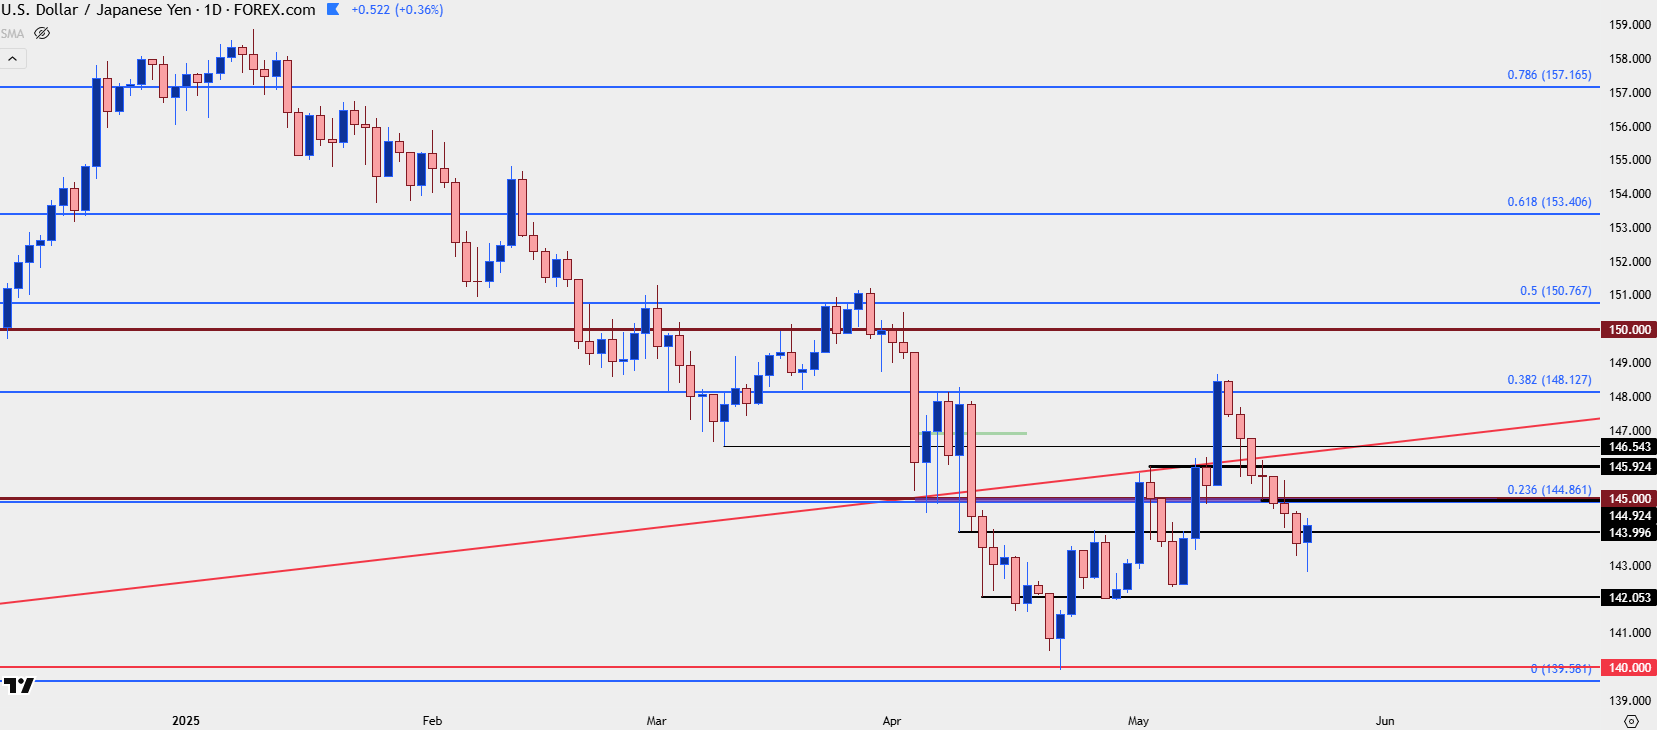 Chart prepared by James Stanley; data derived from Tradingview
EUR/JPY
EUR/JPY is spending its 10th week at resistance from 163.00-163.38, and today’s daily bar showed a high right at the Fibonacci level. Longer-term, there remains a descending triangle formation at-play but before support at 155.00 comes into view, there’s the 160.00 handle that bears failed at in March.
For JPY strength I still prefer EUR/JPY versus USD/JPY, at the moment.
EUR/JPY Weekly Price Chart
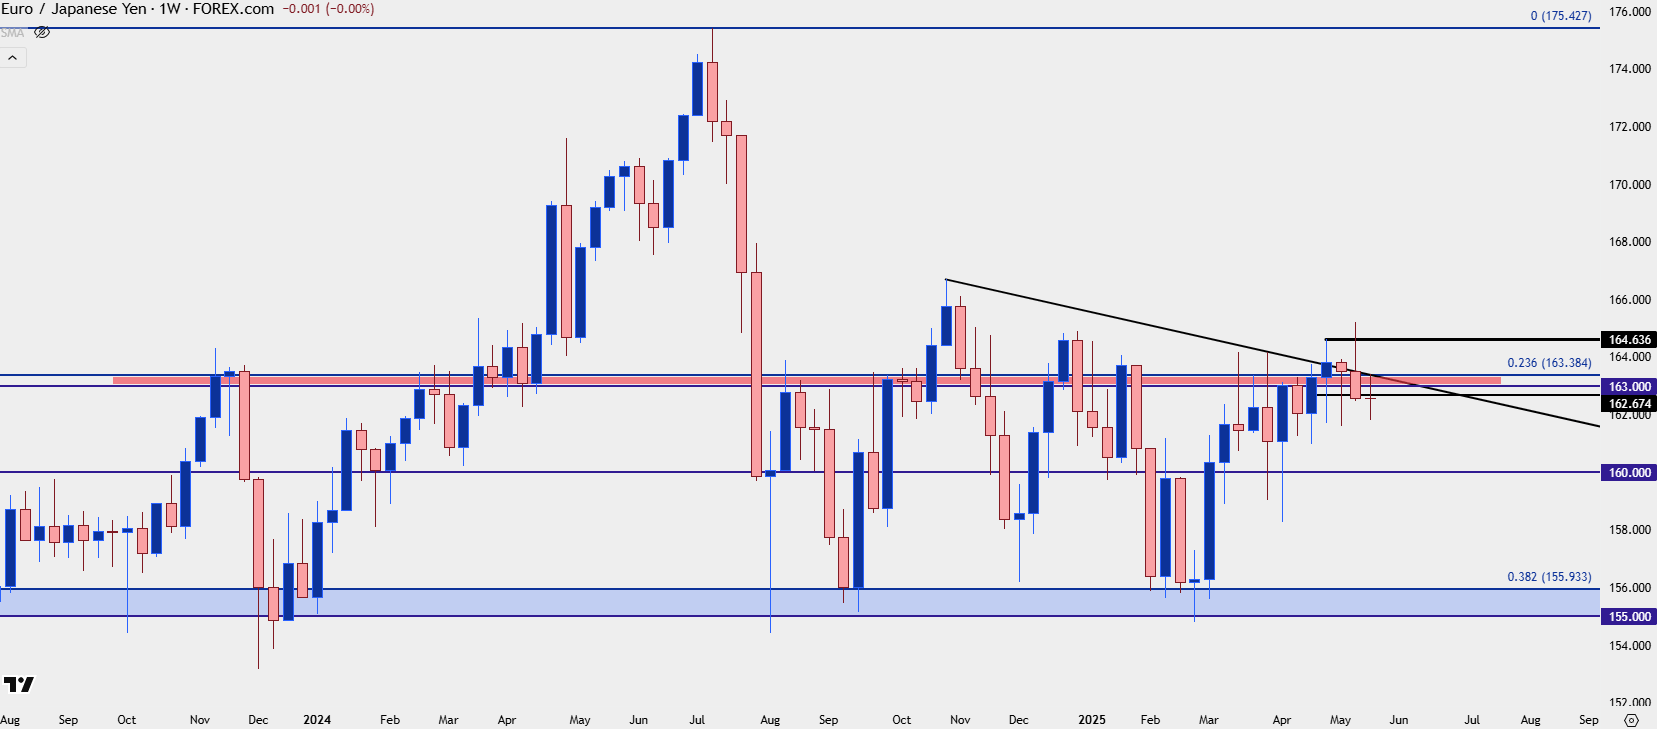 Chart prepared by James Stanley; data derived from Tradingview
GBP/JPY
I’ve written about the 193.61 level in GBP/JPY as this marks the bottom of a long-term gap in the pair from back in 2008. That price has had impact in several ways on a shorter-term basis and as of now it’s been resistance for the past two weekly bars. That price remains of interest for shorter-term themes, as bulls taking it out would illustrate greater control which would re-open the door to topside trend scenarios on shorter-time frames.
For JPY-weakness, I still think that GBP/JPY could carry greater attraction than USD/JPY and sitting overhead, it’s the 195.00 level that remains a big spot of reference for continuation setups.
GBP/JPY Weekly Price Chart
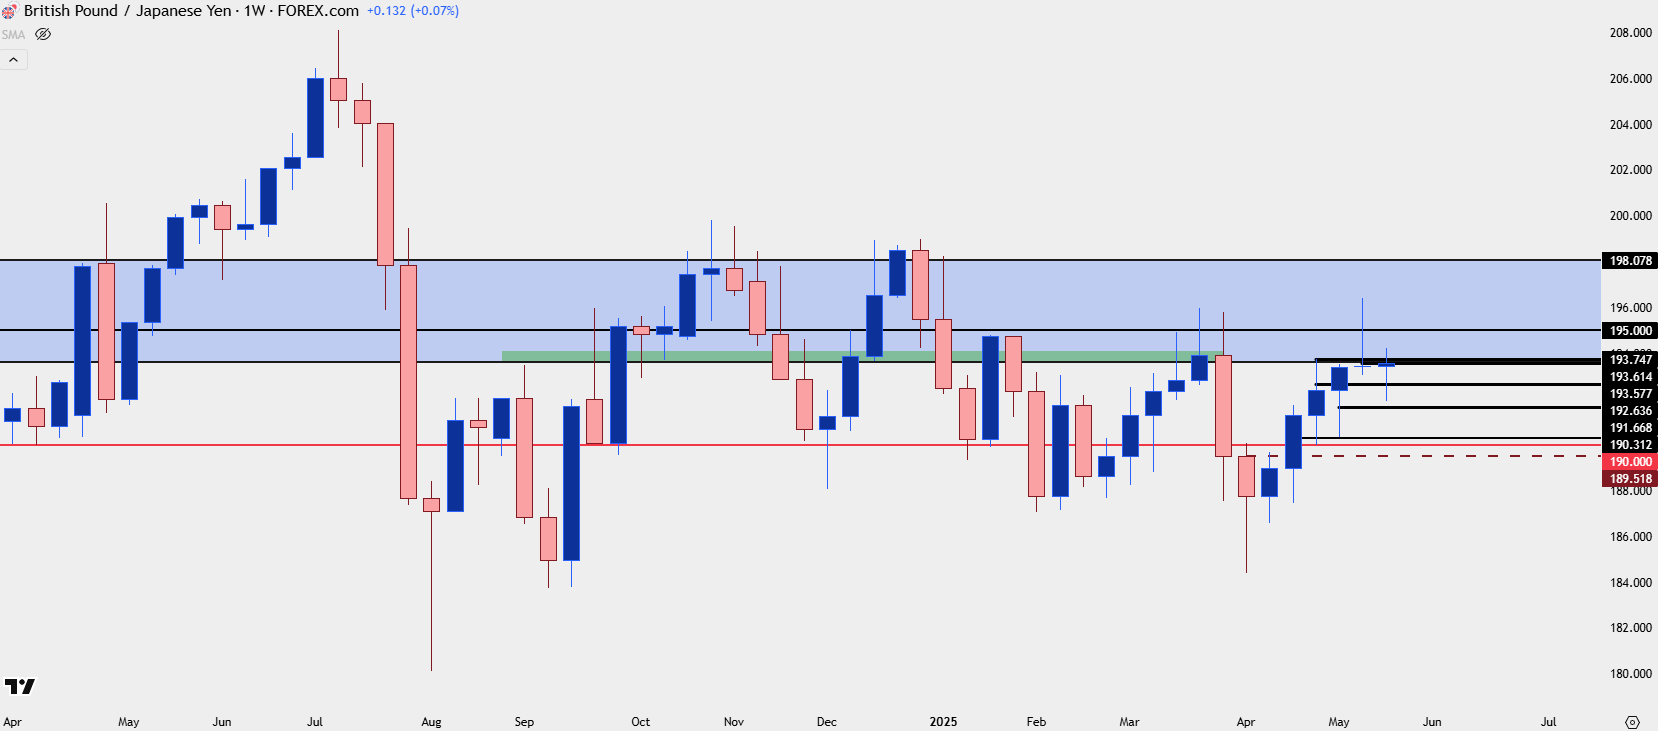 Chart prepared by James Stanley; data derived from Tradingview
--- written by James Stanley, Senior Strategist
Latest market news
September 18, 2025 02:48 PM
June 23, 2025 01:22 PM
June 23, 2025 10:39 AM
June 20, 2025 05:23 PM
June 20, 2025 04:46 PM
June 20, 2025 03:35 PM

June 23, 2025 10:39 AM

June 20, 2025 04:46 PM

June 20, 2025 12:21 PM

June 19, 2025 10:00 AM