

View related analysis:
- USD/JPY, USD/CAD, AUD/USD Outlook: US Dollar Rallies on Tariff Pause
- ASX 200 Slips Amid Cautious Sentiment Ahead of Key US Data
- AUD/USD, Nasdaq Soar as Trump Blinks First, Sparking Epic Market U-Turn
- ASX 200 Hang Seng Analysis: Bears Shaken Out From Wall Street Surge
Using the daily close chart, the Nasdaq 100 futures market set its most recent record high on Monday, 16 December 2024. It wasn’t until late February that bearish momentum truly took hold, but by 4 April the Nasdaq had confirmed a technical bear market—defined as a 20% decline from the recent high on a closing basis. That marked a span of 75 trading days between its peak and bear market confirmation. Remarkably, that entire bear market has now been erased in just 23 trading days.

If Nasdaq bulls can unwind a bear market in a third of the time it took to form, perhaps the cycle low is already in place.
On the flip side, many a market veteran might be quick to point out that bear market bounces—and volatile rallies within a broader downtrend—have a habit of sucker-punching bulls into believing the worst is over, only for momentum to reverse lower once again. That said, with Trump’s trade war quickly winding down, I see a reasonable case for the Nasdaq and its Wall Street peers to reach new record highs before any fresh tests of cycle lows.

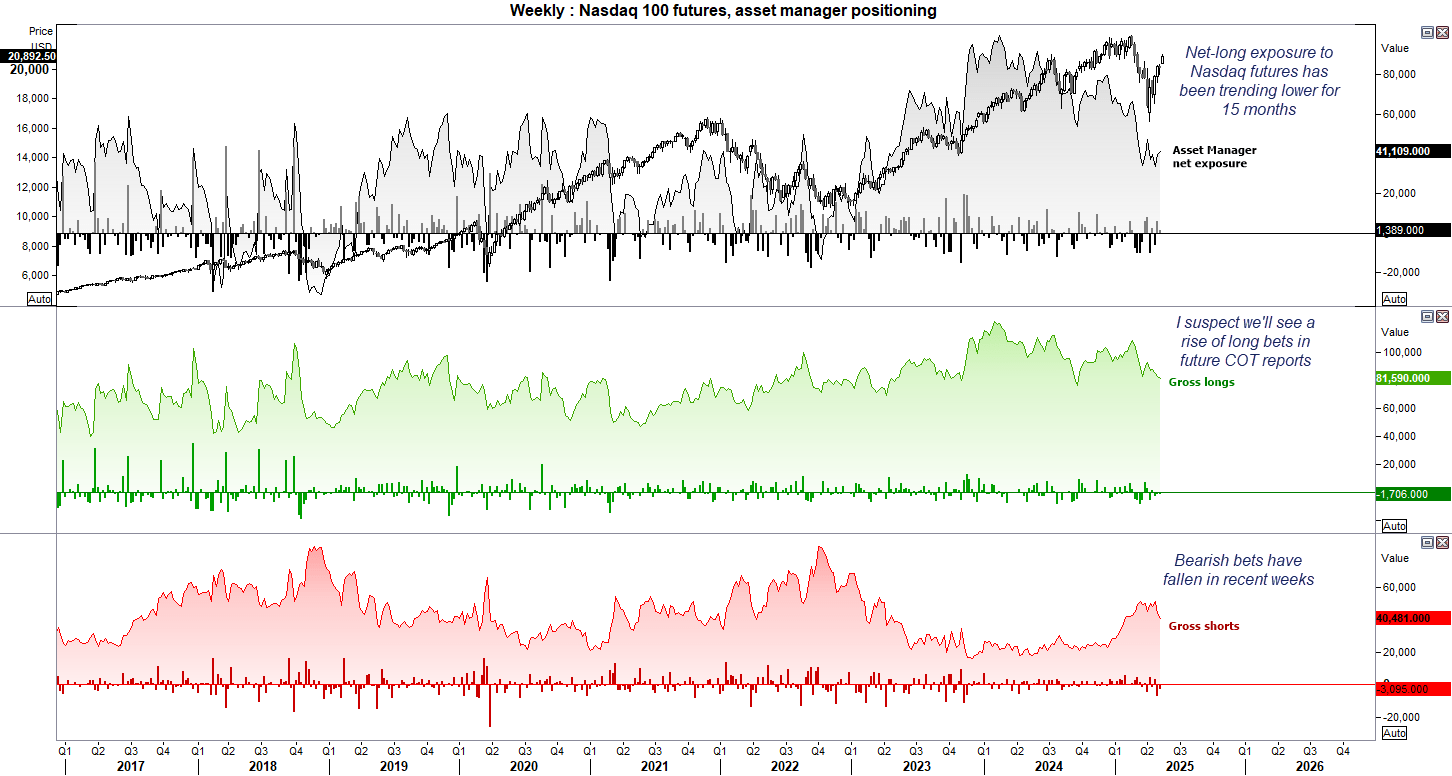
Nasdaq 100 Futures Positioning (NQ): Weekly COT Report Analysis
With Nasdaq futures ripping higher on positive trade headlines, the case builds for asset managers to get behind the bullish move. Net-long exposure has been trending lower for the past 15 months but has stabilised around 35,000 contracts in recent weeks. Gross shorts have also diminished, signalling a lack of conviction to bet against the tech sector. I believe asset managers may now be tempted to rejoin the party.
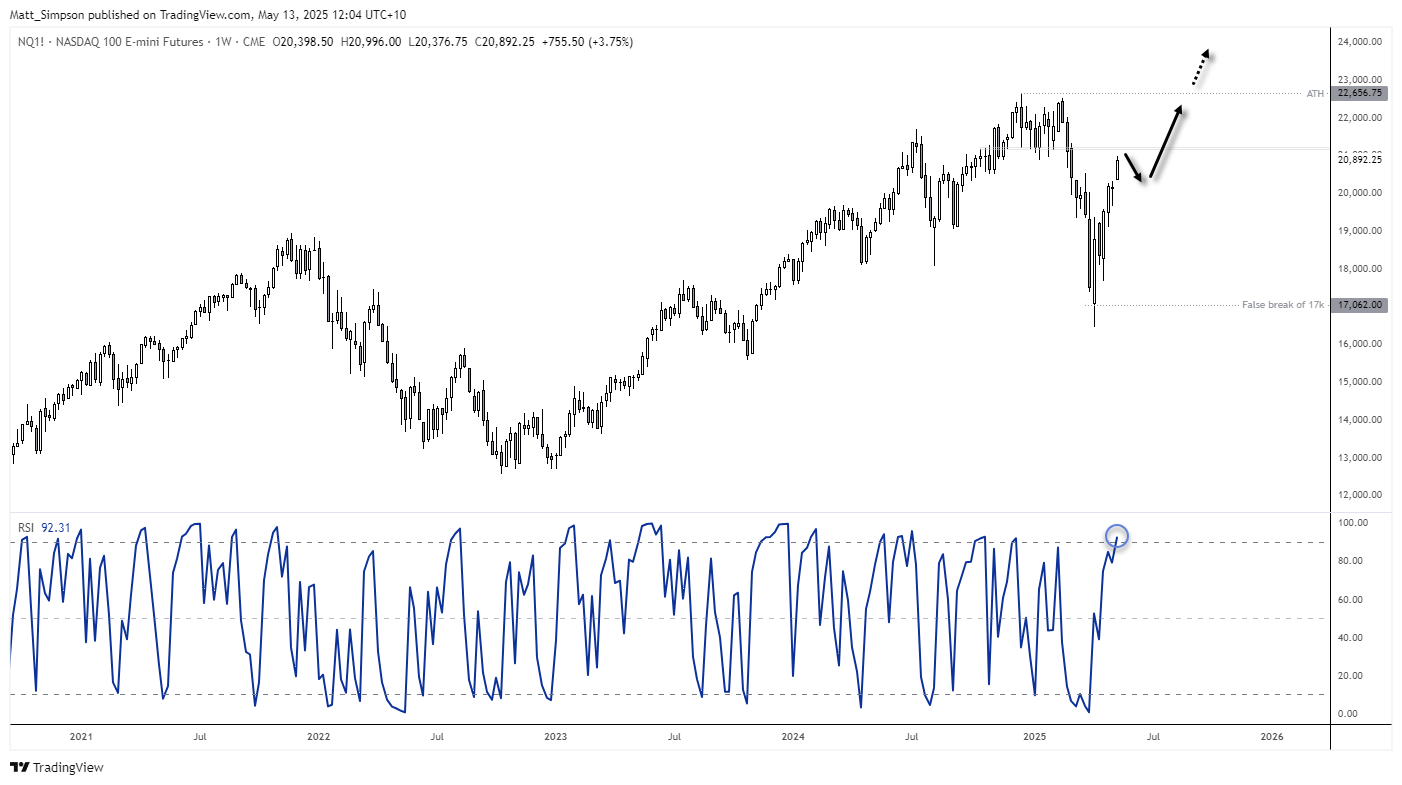
Nasdaq 100 Futures Technical Analysis: US Tech Index Outlook
The low-to-high range of the Nasdaq is now 27% from the April low and the weekly RSI (2) has moved into the overbought level. However, with 21k and a support cluster ~21,200 nearby, perhaps we are nearing the end of this initial bounce. While I favour a break to a new high in the coming weeks or months, the preference is to seek dips and not chase the move. 20k seems like an obvious support level on this timeframe, should it be allowed to retrace this far.

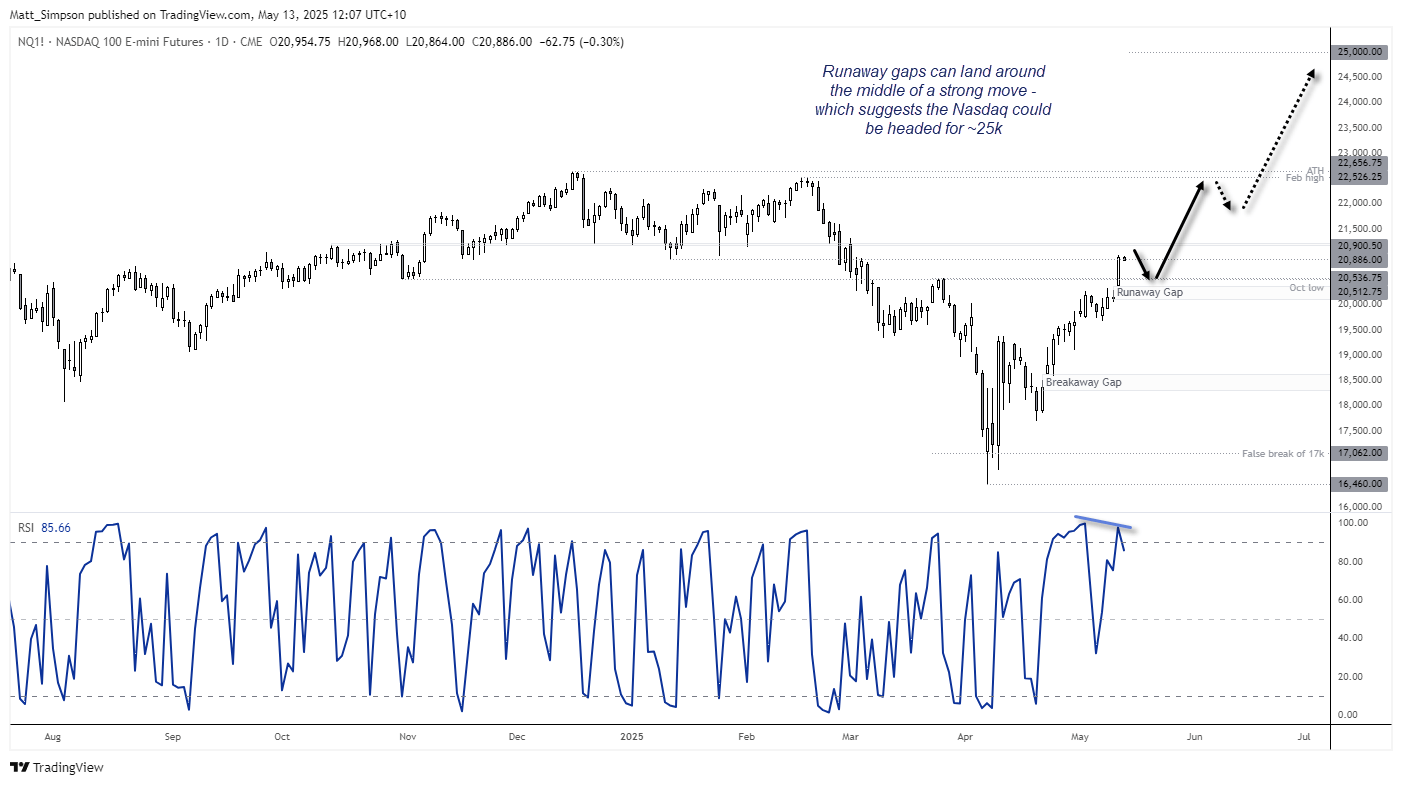
Nasdaq 100 Futures Technical Analysis: Daily Chart
The daily chart shows an upside gap, its second such move since the April low. The breakaway gap on April 22 marks the required shift in sentiment, back when traders were still expecting the Nasdaq to trend lower. That means Monday’s gap could be the runaway gap – typically found around the middle of a trending move. If so, it implies the Nasdaq could be headed for 25k.
Take note of the bearish divergence on the daily RSI (2) to warn of potential weakness. Though I expect any pullback to be shallow given the runaway gap and strong bullish candle on Monday.
-- Written by Matt Simpson
Follow Matt on Twitter @cLeverEdge
Latest market news
September 18, 2025 02:48 PM
June 23, 2025 01:22 PM
June 23, 2025 10:39 AM
June 20, 2025 05:23 PM
June 20, 2025 04:46 PM
June 20, 2025 03:35 PM

June 17, 2025 02:00 PM

June 12, 2025 06:08 AM

May 28, 2025 11:01 AM

May 22, 2025 11:14 AM