

Following an impressive late-session rally yesterday, US index futures found themselves under pressure, leading to a weaker open on Wall Street today. But at the time of writing, the indices were trying to bounce off their earlier lows after Howard Lutnick, the US Secretary of Commerce, said that the tariff reprieve is likely to include all USMCA products. The news caused the Canadian dollar and Mexican peso to rally sharply. Could we see the relief rebound to turn into a more significant recovery now? In Europe, there is optimism surrounding Germany’s ambitious spending plans, sending the DAX to a fresh all-time high earlier today. The question now is whether dip-buyers will make a return, as they have in recent sessions, and provide a boost to the Nasdaq 100 outlook by lifting it from a key support area. The Nasdaq and S&P 500 are both at pivotal junctures, testing their respective 200-day moving averages alongside key tech names such as Amazon, Oracle, Tesla, and MicroStrategy.

Earlier, sentiment was dampened by a disappointing revenue outlook from Marvell Technology, curbing enthusiasm among investors banking on continued strength from the AI boom. Meanwhile, Broadcom, another key player in the AI space, saw its shares decline ahead of its earnings release. But on the back of Lutnick comments, we have started to see a bit of recovery. Let’s see how the markets will behave heading deeper into the US session.
Nasdaq 100 outlook: Technical analysis and key levels to monitor
US markets have witnessed consistent dip-buying in recent days, with the 200-day moving average emerging as a focal point—not just for the Nasdaq 100, but for the S&P 500 and several individual stocks, including Amazon, Oracle, Tesla, and MicroStrategy.
Examining the daily chart of Nasdaq 100, the 20,000-20,265 range is particularly significant (shaded in light blue on the chart). This area marked the start of the last election-driven rally, kicking off the Trump trade in November—making it both a key technical and psychological zone. Further reinforcing its importance, the 200-day moving average aligns with this range. The index’s movement from here will be crucial for its near-term Nasdaq 100 outlook.
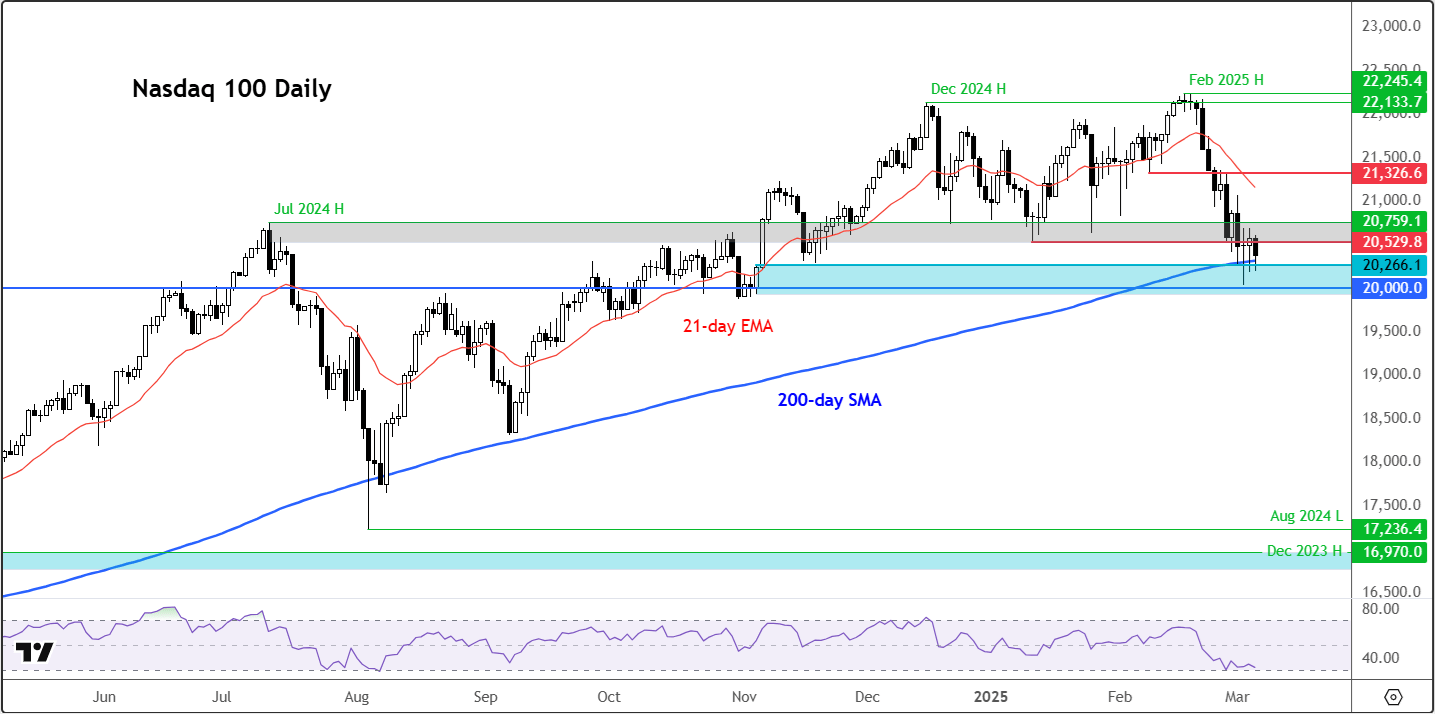
The daily RSI has now dipped to near 30, indicating that the index is no longer in overbought territory and is approaching slightly oversold conditions—at least on daily and lower timeframes. The weekly RSI sits below 50, while the monthly RSI is no longer above the overbought threshold of 70. With these factors in mind, the Nasdaq 100 is well within the buy-the-dip territory for bullish traders. The key question is whether buyers will step in to halt this short-term downward trend.
If the bulls regain control, we could see a push towards 20,530, a level that now forms the lower boundary of a key resistance range extending to approximately 20,760. This 20,530-20,760 range had previously acted as support multiple times in December, while its upper boundary was the previous all-time high set in July 2024. This resistance zone has been actively defended by bears in recent sessions, making it a critical area. A decisive break above it could mark a bullish reversal, opening the door for a broader recovery.
Conversely, should selling pressure persist and the index break below the 20,000-20,265 support range, it could trigger a deeper correction—one not seen in several years.
Key stocks testing the 200-day moving average
Several prominent stocks are currently testing their respective 200-day moving averages, including Amazon, Oracle, Tesla, and MicroStrategy. Whether or not these names will be able to rebound will impact the Nasdaq 100 outlook.
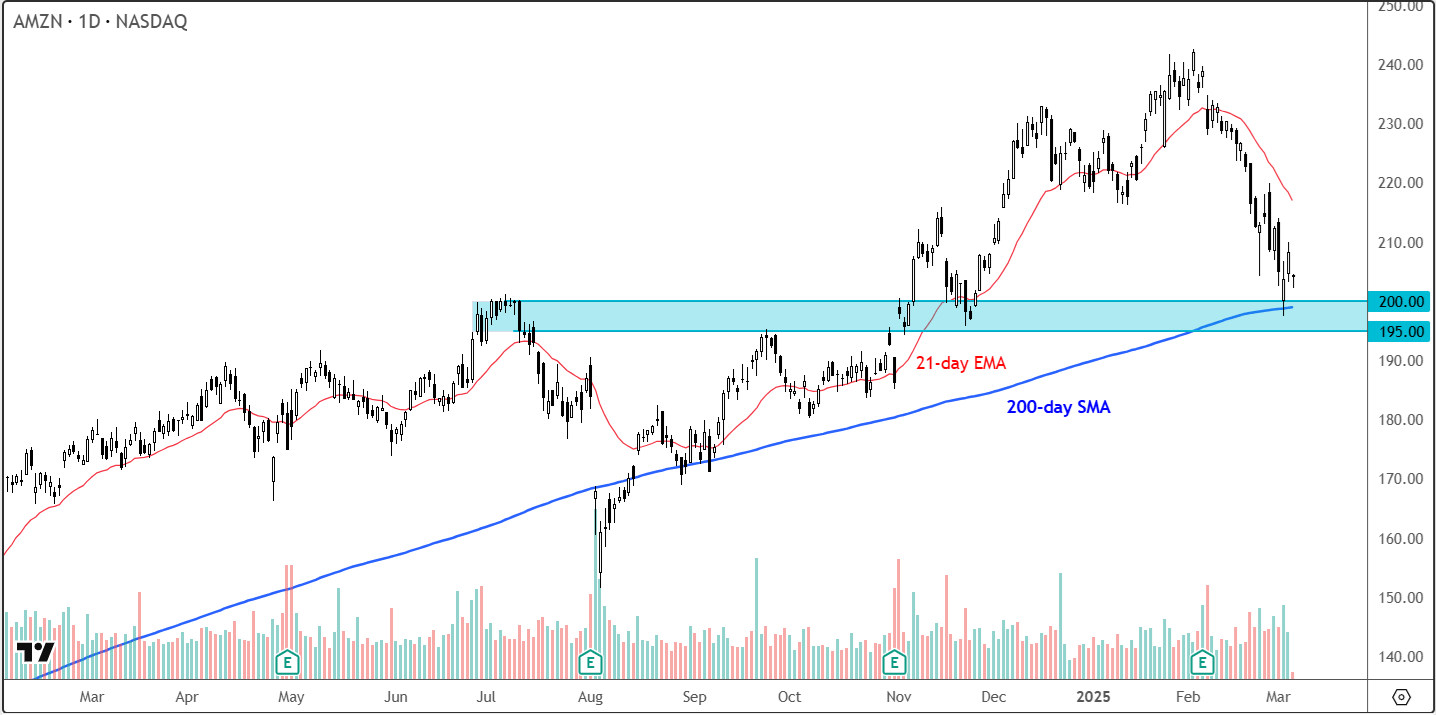
Amazon (AMZN) gapped lower on Tuesday but found strong buying interest around the critical 195-200 support zone, where prior resistance and the 200-day MA intersect. While this bounce was encouraging, more confirmation is needed to determine whether fresh momentum will push the stock higher or if it was merely a temporary relief rally.
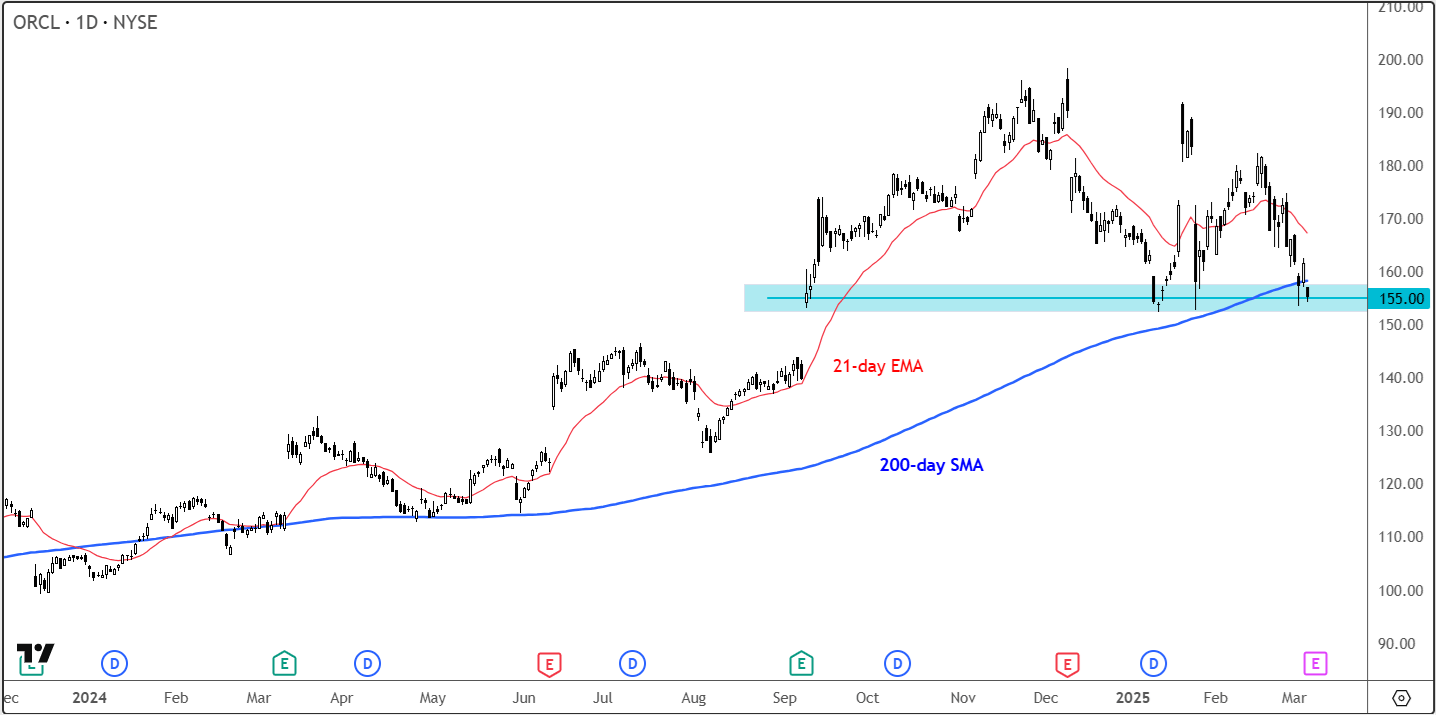
Oracle (ORCL) is approaching a key technical juncture ahead of its earnings report on March 10. The last time the company announced earnings in September, its stock surged and has since maintained support around the 155 level. Notably, the 200-day moving average has now caught up with the price, currently sitting near 158, making the 155-158 zone a crucial area to monitor. So far, the stock has held above this area—whether it continues to do so leading into its earnings report remains to be seen.
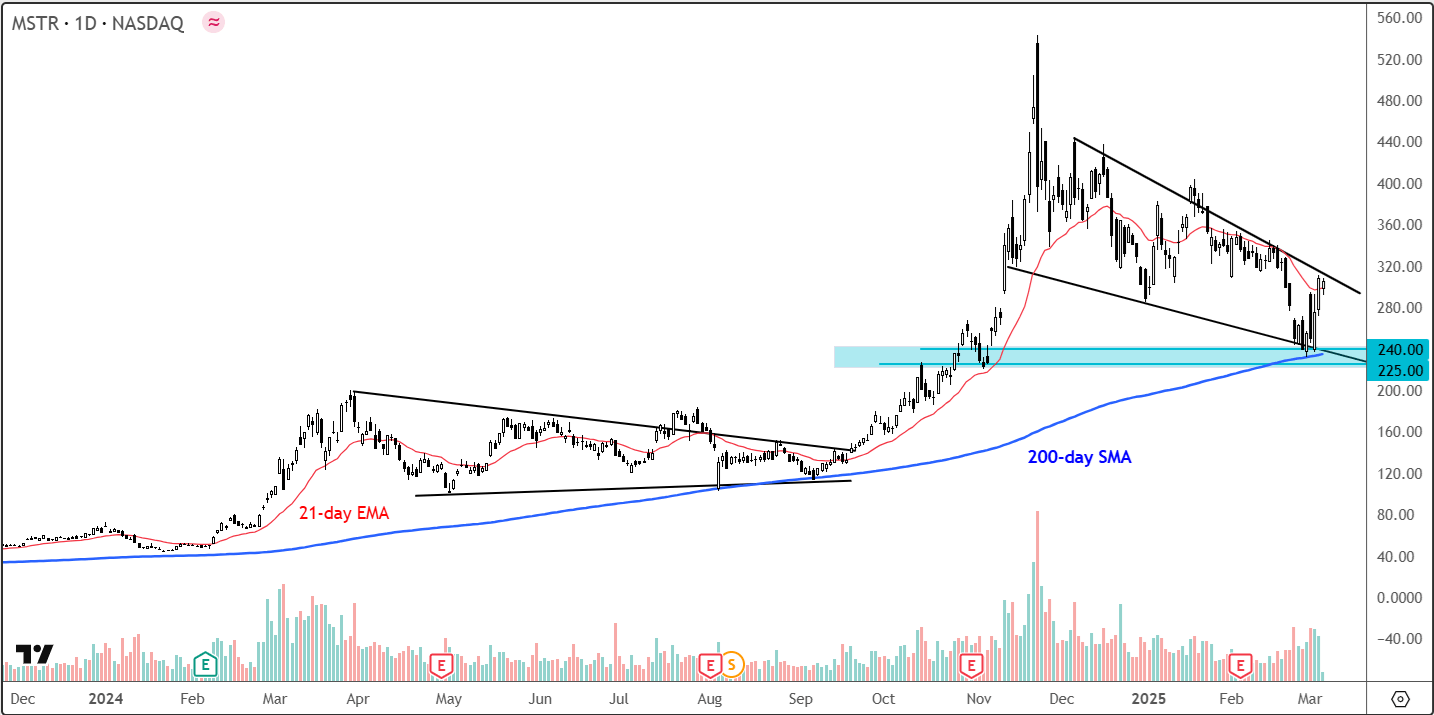
MicroStrategy (MSTR) has bounced convincingly off its 200-day moving average, and it was showing relative strength compared to other tech names. The support trendline from a falling wedge pattern has further aided the rebound within the 225-240 range. A breakout above the wedge’s resistance could indicate a continuation of the broader uptrend. Let’s see if that happens today.
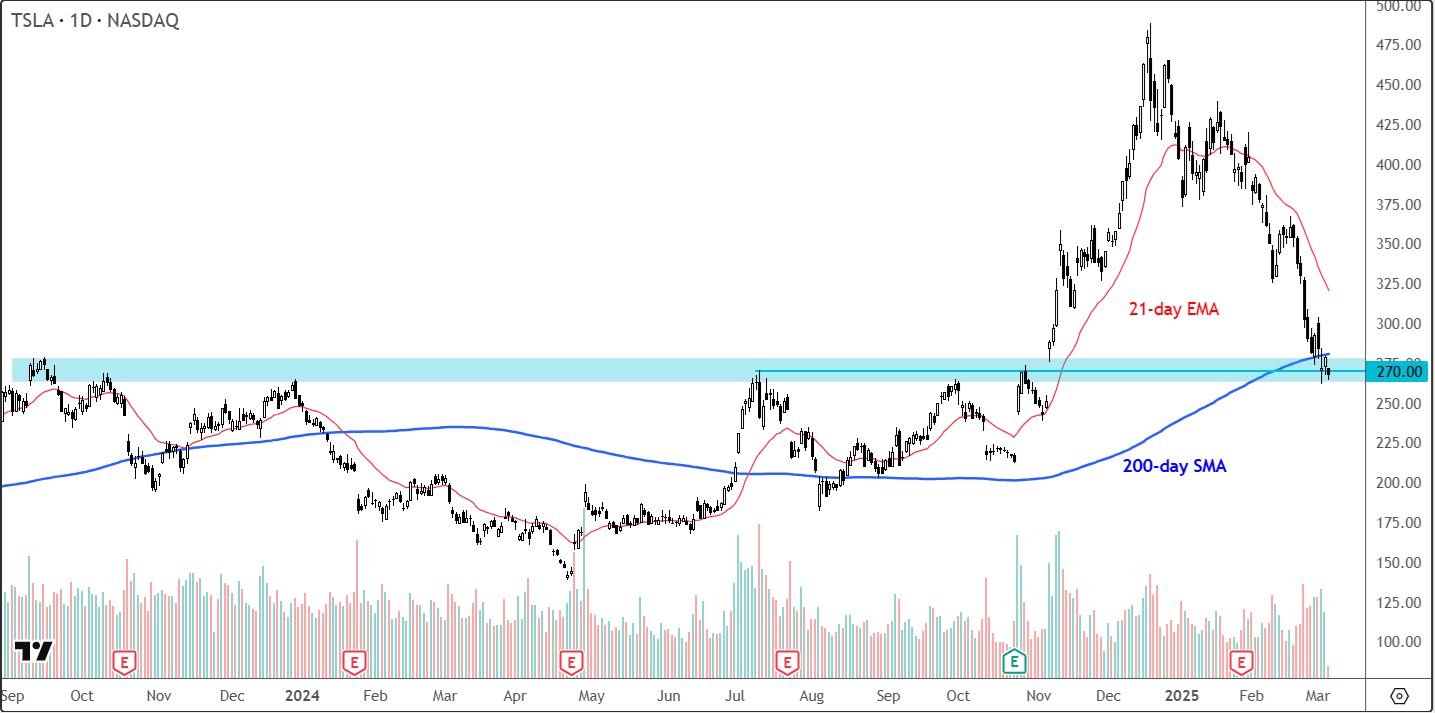
Tesla (TSLA) is also sitting at a key support zone between 260-280, an area that previously acted as resistance before the stock surged past it after Trump’s win at the elections (which has benefited his buddy, Elon Musk). Interestingly, the 200-day moving average is also situated within this range. While Tesla stock has seen a modest, short-lived, rebound in recent days, it remains to be seen whether a sustained bullish reversal will materialise—not just for Tesla but for the Nasdaq 100 as well.
Source for all charts used in this article: TradingView.com
-- Written by Fawad Razaqzada, Market Analyst
Follow Fawad on Twitter @Trader_F_R
Latest market news
Today 06:16 PM
Today 08:32 AM