

View related analysis:
- If Consumers Don’t Consume, a Recession Could be Presumed
- EUR/USD, Dollar Index, VIX Analysis: COT report
- AUD/USD weekly outlook: RBA, ISMs and NFP in Focus
- Nasdaq 100, S&P 500 Feel the Force of Trump’s Tariffs, ASX to Open Lower
S&P 500, Nasdaq quarterly charts
To be exact, we just witnessed the worst quarter for the S&P 500 and Nasdaq 100 futures in 11 quarters. Their Q1 bearish candle not only snapped a 5-quarter winning streak for both indices but also formed bearish engulfing candles. Given this happened the month following a record high, I was intrigued to see how reliable this pattern could be on this timeframe.
Having looked through futures data for the Nasdaq 100 and S&P 500, I have manually marked either a bullish engulfing or bearish outside quarter.

- There are only six prior occurrences on the Nasdaq 100, and seven on the S&P 500
- Nasdaq 100 futures have risen 6/7 quarters, after a bearish engulfing or outside quarter has occurred
- S&P 500 futures have risen 5/7 quarters, following a bearish outside or engulfing quarter
- Or put another way, the Nasdaq has only declined for a second consecutive quarter on one occasion following a bearish outside or engulfing quarter, whereas the S&P 500 has fallen twice
From this metric alone, the odds do not appear great enough to assume another consecutive bearish quarter.
But if we factor in Trump’s tariffs, weaker consumer sentiment and rising inflation expectations, I don’t feel inclined to simply bet on a bullish Q2 either from these stats. Each data point has a story behind it, and context can matter.

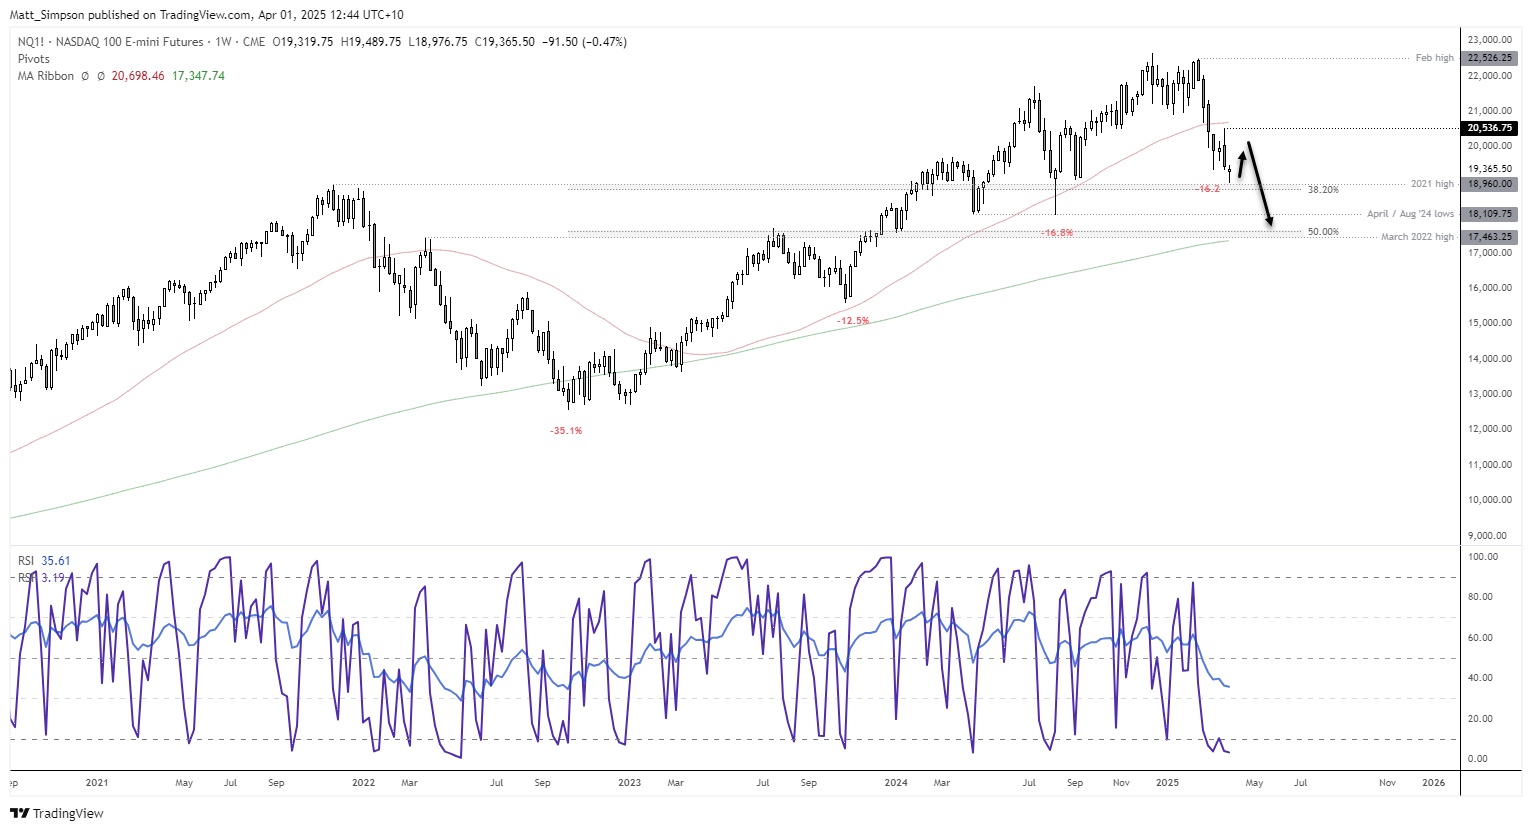
Nasdaq 100 Technical Analysis
The weekly chart shows prices are holding just above the 2021 high, near a 38.2% Fibonacci level. The RSI (2) oversold, though no bullish divergence has formed, while the RSI (14) is confirming the bearish price action and not yet oversold. This suggests further lows, even if we need to allow for a few corrective bounces along the way.
Last week’s prominent bearish engulfing candle and 50-week SMA suggest resistance arounds 20,536 – 20,700, assuming any corrective bounce can make it that far. The core bias is for a move down towards the 200-week SMA, with the March 2022 high (17,436), 50% retracement level and swing lows ~18,100 potentially providing interim support levels along the way.

S&P 500 technical analysis
While I also have a bearish bias for the S&P 500, it is not as bearish as the Nasdaq 100. While both indices fell in Q1, the losses on the S&P just under half seen on the Nasdaq. Furthermore, asset managers are actively betting against the Nasdaq and have been stepping away from longs for much longer period, compared with the S&P 500 (more on that below).
Last week’s bearish engulfing high met resistance at the 50-week SMA and November low. A small bullish divergence has formed on the RSI (2) in the oversold zone, so perhaps this could be the better bet for Wall Street bulls over the near term. But like the Nasdaq, I will also been seeking evidence of a swing high beneath its respective bearish engulfing high in anticipation of further losses.
Downside targets for bears could include the 2021 high, or 5400 handle just above it. A break beneath which brings a potential support zone ~5200 into view, and the 200-week SMA or 2023 high, just above thew 5,000 handle.

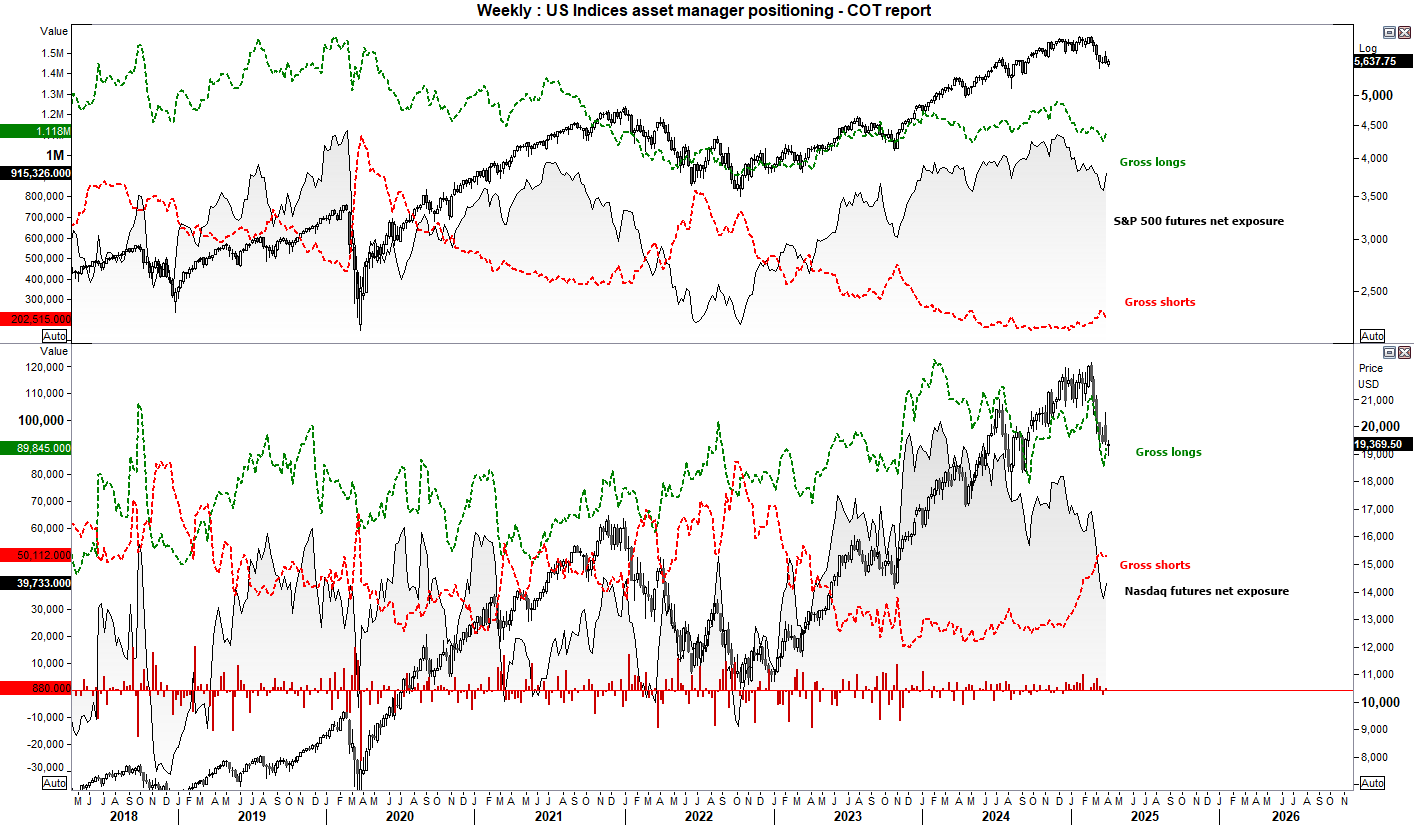
S&P 500 (ES), Nasdaq 100 (NQ) futures market positioning – COT report
- Asset managers increased net-long exposure to S&P 500 and Nasdaq futures for the first week in five last week
- S&P 500 gross longs rose 49.7k contracts (fastest pace in 17 weeks) and shorts decreased by -202.5k contracts (fastest pace in 32 weeks)
- But the fact that prices accelerated lower last week strongly suggest a reversal of these traders, so I suspect we’ll see net-long exposure fall in the next report
- Looking at the bigger picture, net-long exposure to Nasdaq futures topped in February 2024, and short bets against it have been trending higher this year
- While shot bets against the S&P 500 remain relatively low, net-long exposure topped in December
-- Written by Matt Simpson
Follow Matt on Twitter @cLeverEdge
Latest market news
September 18, 2025 02:48 PM
June 23, 2025 01:22 PM
June 23, 2025 10:39 AM
June 20, 2025 05:23 PM
June 20, 2025 04:46 PM
June 20, 2025 03:35 PM

June 9, 2025 09:32 AM

May 12, 2025 06:44 AM
April 27, 2025 02:00 PM