

- NZD/USD prints bearish key reversal, closes below 200DMA
- Correlations unwind as capital piles back into the USD
- .5854, .5750 and .5640 the key downside levels to watch
- Risk appetite and U.S. data likely to drive price action this week
Summary
The script has flipped for the U.S. dollar following the 90-day tariff pause agreed between the United States and China over the weekend, resulting in the greenback logging its largest one-day increase since the U.S. presidential election on Monday. With riskier assets ripping higher as investor sentiment swells, the desire for safe havens is dwindling by the second. Rolling with a perfect correlation with gold and the Swiss franc against the U.S. dollar over the past week, the New Zealand dollar is also on that list. Having printed a bearish key reversal candle on Monday, slicing through the 200-day moving average in the process, directional risks for the Kiwi are skewing lower.
NZD Safe Haven?
One of the remarkable things about the past week is just how strongly correlated prices have been across multiple asset classes, and NZD/USD has been no exception. That can be seen on the right-hand pane in the chart below, which shows the rolling five-day correlation the pair has had with a variety of different market variables.
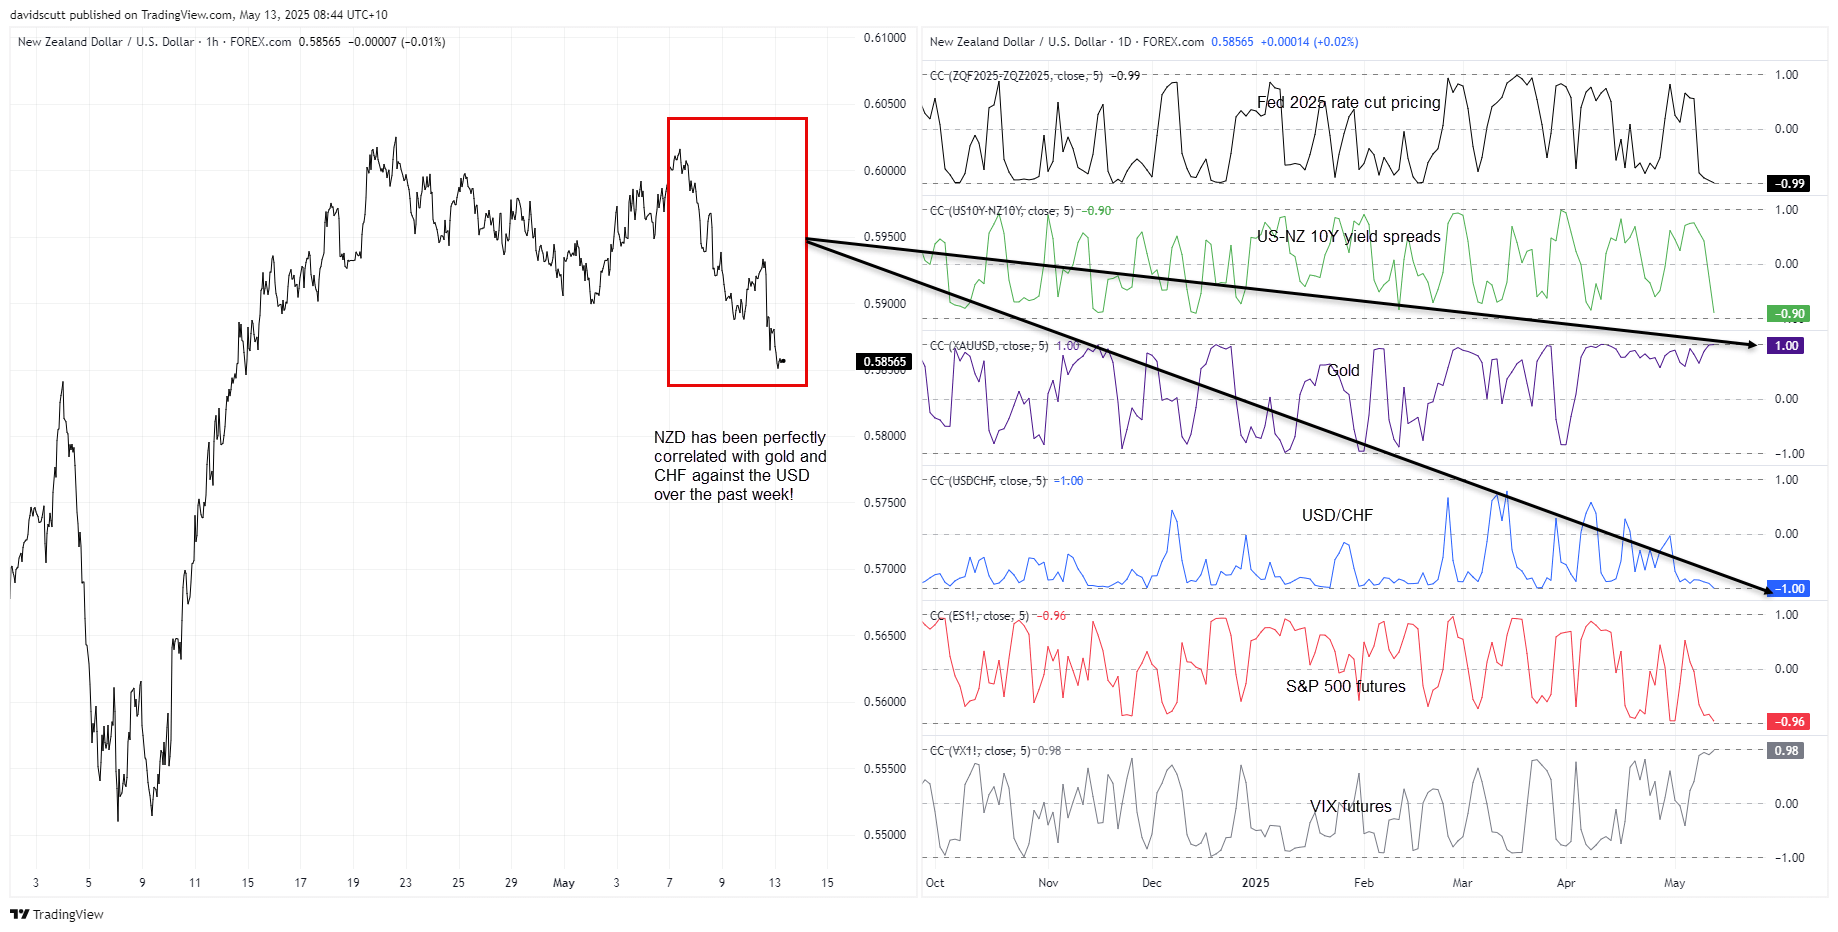
Source: TradingView
What immediately stands out is the perfect correlation the Kiwi has seen with gold and the Swiss franc against the USD over this period, arguing the case for the Antipodean currency being treated as a safe haven by traders. Bolstering that view, it has also seen a near-perfect correlation with VIX futures, and an inverse correlation with S&P 500 futures, over the same stretch. As risk appetite roars and Fed rate cut pricing recedes, NZD/USD’s relationship with interest rate differentials has strengthened rapidly as well.
It really has been just one trade, and right now it’s capital piling into the USD and U.S. dollar-denominated assets, reversing the trend seen over much of April.

NZD/USD Risks Skew Lower
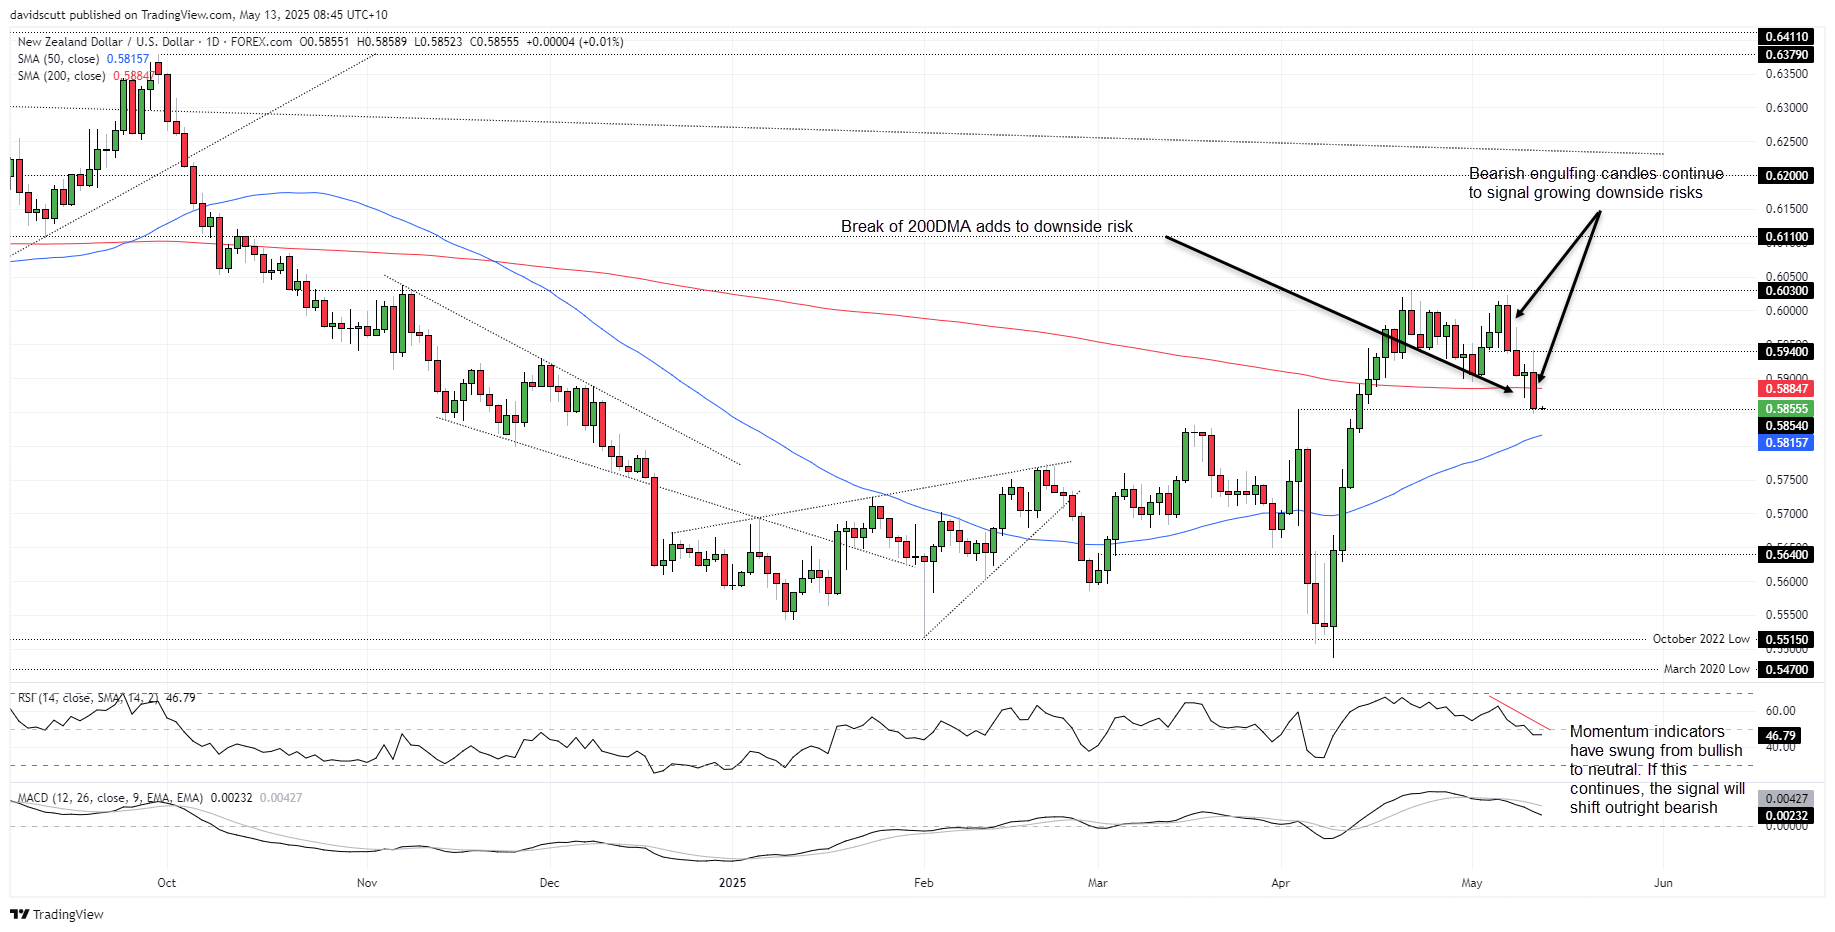
Source: TradingView
NZD/USD looks at risk of extending the downtrend seen over the past week, not only printing a key bearish reversal candle on Monday but also closing beneath the key 200-day moving average. It often tests the 200 but breaks often fail to stick, so Monday’s move should make traders sit up and take notice. With RSI (14) and MACD moving towards neutral territory, the momentum picture is quickly shifting towards selling rallies being the preferred way to play it. It’s not there yet, but the close beneath the 200 has skewed near-term directional risks lower.
For now, the NZD/USD unwind has stalled at .5854—the high printed just before Liberation Day upended markets. If this level were to buckle, the 50-day moving average, .5750 and .5640 are levels to watch on the downside. Above, sellers may emerge on any pushes back towards the 200-day moving average.
With little on the New Zealand economic calendar to trouble traders this week, it will be the U.S. data that garners most attention. I covered the event risk in detail in a separate post over the weekend, so would encourage you to take a glance if interested. In a nutshell, given how rapidly the macroeconomic environment is changing, moves sparked by the inflation and retail sales reports may prove to be short-lived. Trade policy is, and remains, the key influence on markets right now—including on NZD/USD.
NOW READ:
USD/CHF Climbs, Gold Pressured as Risk Sentiment Improves on Trade Reset
Follow David on Twitter @scutty
Latest market news
September 18, 2025 02:48 PM
June 23, 2025 01:22 PM
June 23, 2025 10:39 AM
June 20, 2025 05:23 PM
June 20, 2025 04:46 PM
June 20, 2025 03:35 PM

May 14, 2024 01:20 AM
August 18, 2023 01:36 AM

August 17, 2023 11:05 PM

October 26, 2022 01:00 PM