

Crude Oil Technical Forecast: WTI Weekly, Daily & Intraday Trade Levels
- Oil prices surge into June as May rally extends to two-month highs
- WTI bulls testing major pivot zone today- risk for exhaustion / price infection ahead
- Resistance 65.62-66.31, 70.95-71.90 (key), 78- Support 59.16-60.31, 54.36/48 (key), 51.68
Crude oil prices have surged more than 20.9% off the yearly lows with WTI testing a major resistance pivot today in U.S. trade. The focus is on possible inflection off this threshold with a close above needed to keep the immediate advance viable. Battle lines drawn on the weekly, daily, and 240min technical charts.
Review my latest Weekly Strategy Webinar for an in-depth breakdown of this crude oil setup and more. Join live on Monday’s at 8:30am EST.Oil Price Chart – WTI Weekly
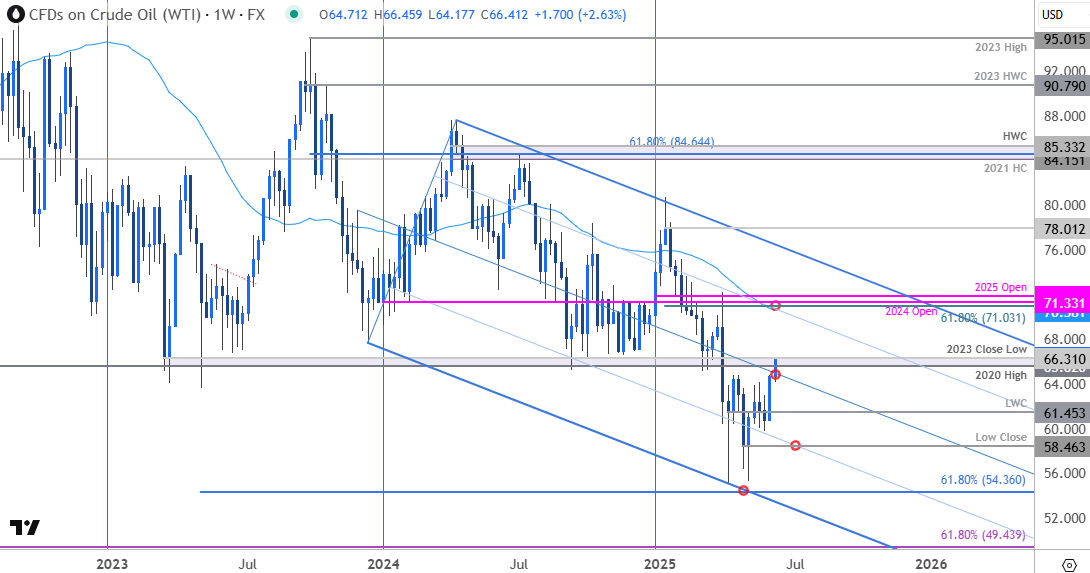
Chart Prepared by Michael Boutros, Technical Strategist; WTI on TradingView
Technical Outlook: Oil prices are poised to mark a second consecutive weekly advance with WTI up more than 9.6% since the start of the month. The rally is attempting to breach the median-line this week with key resistance eyed at 65.62-66.31- a region defined by the 2020 swing high and the 2023 close low. A weekly close above this key pivot zone is needed suggest a more significant low is in place / a larger price reversal is underway- looking for a reaction here this week.
Oil Price Chart – WTI Daily
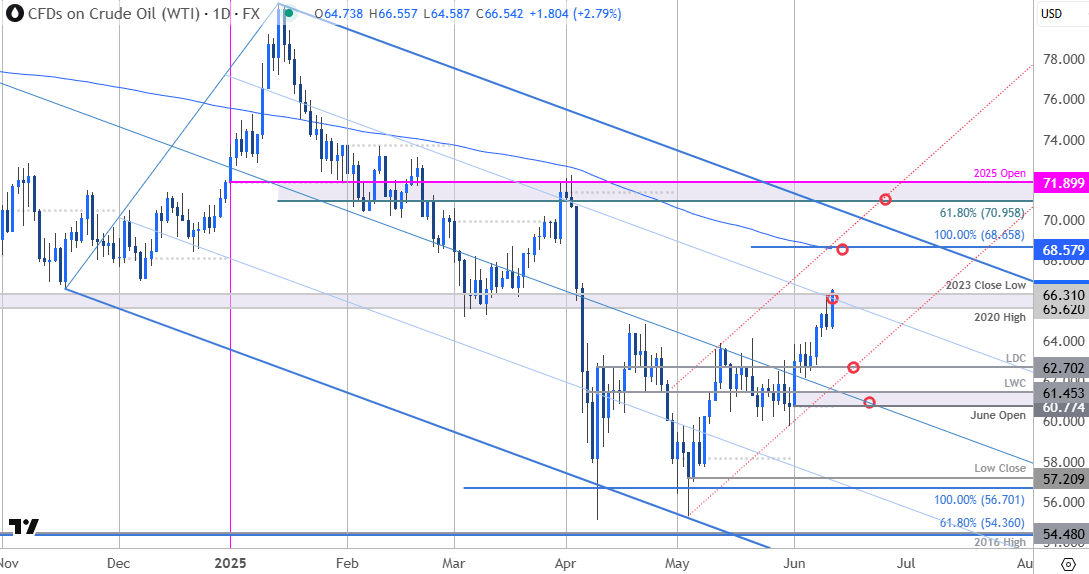
Chart Prepared by Michael Boutros, Technical Strategist; WTI on TradingView
A look at the WTI daily chart show price continuing to trade within the confines of the descending pitchfork we’ve been tracking for months with this recent advance now testing confluent resistance at the 75% parallel. A close above this threshold would expose subsequent objectives at the 100% extension of the May rally / 200-day moving average at 68.58/65. Key resistance / broader bearish invalidation steady at the 61.8% retracement of the yearly range / 2025 yearly open at 70.95-71.90. Both these zones represent areas of interests for possible topside exhaustion / price inflection IF reached.
Oil Price Chart – WTI 240min
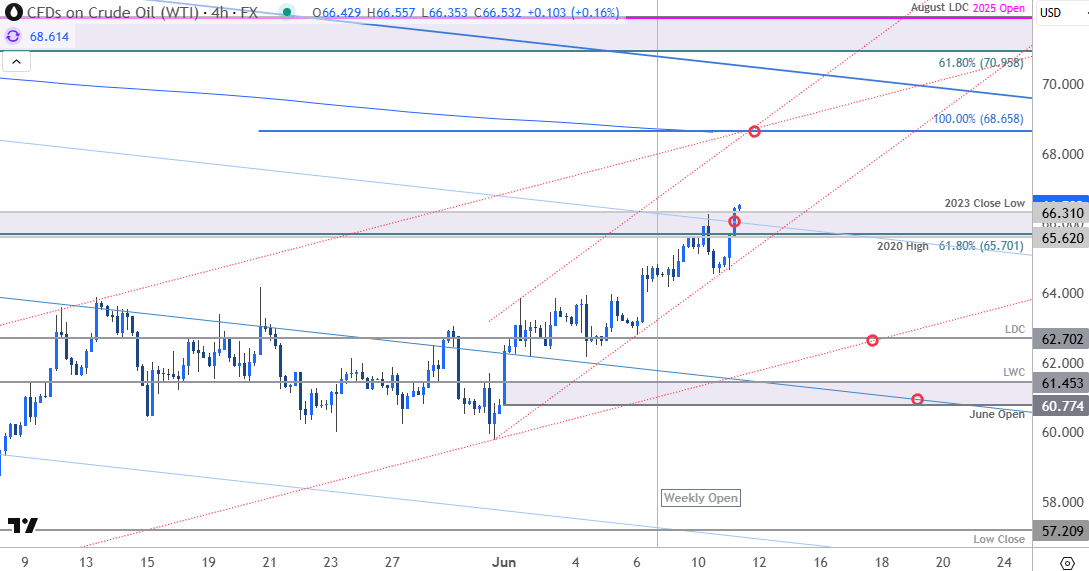
Chart Prepared by Michael Boutros, Technical Strategist; WTI on TradingView
A closer look at oil price action shows WTI trading within an embedded channel off the late-May low. Look for initial support along that slope backed by the yearly low-day close (LDC) at 62.70. Critical support / near-term bullish invalidation now set to the objective monthly open / 2025 low-week close (LWC) at 60.77/61.45. Losses below this threshold would threaten resumption of the broader downtrend in oil.

Bottom line: The oil rally is testing a major resistance pivot today and the focus is on this week’s close with respect to the 65.62-66.31 pivot zone. From a trading standpoint, a good region to reduce portions of long-exposure / raise protective stops- losses should be limited to 62.70 IF price is heading higher on this stretch with a close above 66.31 needed to fuel the next leg of the May advance.
Active Weekly Technical Charts
- Gold (XAU/USD)
- Japanese Yen (USD/JPY)
- Australian Dollar (AUD/USD)
- US Dollar Index (DXY)
- British Pound (GBP/USD)
- Swiss Franc (USD/CHF)
- Euro (EUR/USD)
- Canadian Dollar (USD/CAD)
--- Written by Michael Boutros, Sr Technical Strategist with FOREX.com
Follow Michael on X @MBForex
Latest market news
September 18, 2025 02:48 PM
June 23, 2025 01:22 PM
June 23, 2025 10:39 AM
June 20, 2025 05:23 PM
June 20, 2025 04:46 PM
June 20, 2025 03:35 PM

June 18, 2025 07:38 PM

June 18, 2025 03:24 PM
June 16, 2025 03:30 PM

June 12, 2025 04:08 PM