

Crude Oil Technical Forecast: WTI Weekly, Daily & Intraday Trade Levels
- Oil rebounds from multi-year downtrend- rallies more than 17.6% off yearly low
- WTI recovery losing steam ahead of major resistance hurdle- risk for exhaustion / price inflection ahead
- Resistance 65.62-66.31, 70.95-71.90 (key), 78- Support 59.16-60.31, 54.36/48 (key), 51.68
Crude oil prices are off more than 2.6% this week after rebounding nearly 18% off multi-year lows. WTI is now trading just below initial resistance hurdles and the first major test for the bulls- risk for possible exhaustion / price inflection ahead. Battle lines drawn on the weekly, daily, and 240min technical charts.
Review my latest Weekly Strategy Webinar for an in-depth breakdown of this crude oil setup and more. Join live on Monday’s at 8:30am EST.Oil Price Chart – WTI Weekly
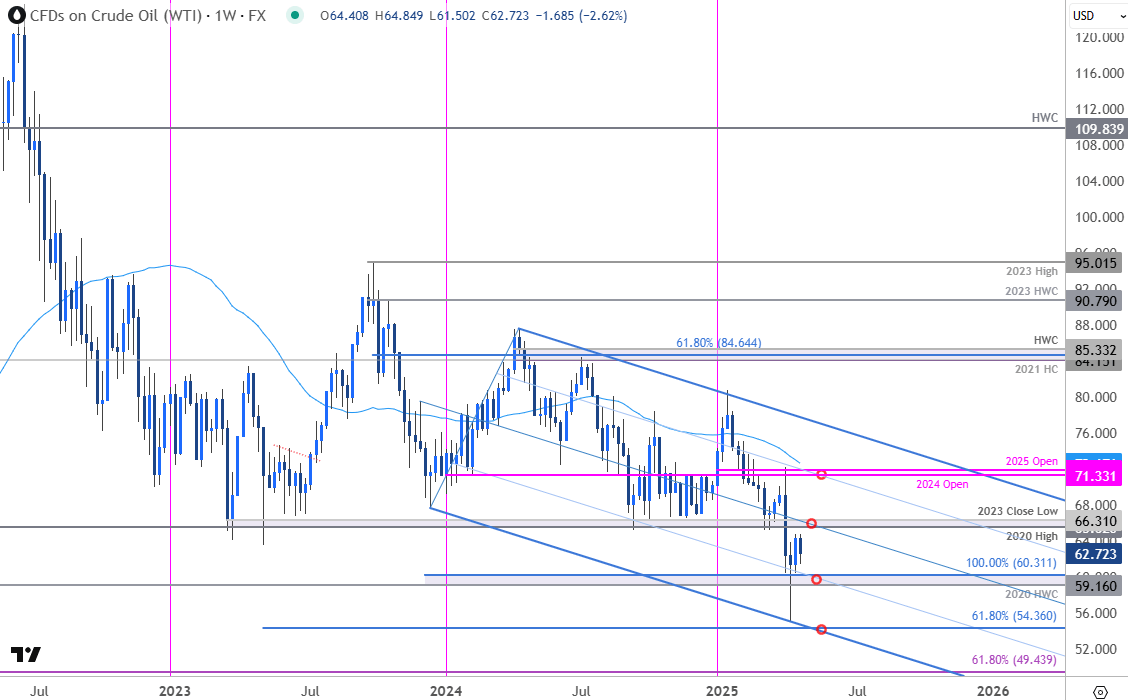
Chart Prepared by Michael Boutros, Technical Strategist; WTI on TradingView
Technical Outlook: Oil pieces rebounded off downtrend support this month after plunging nearly 32% off the yearly highs. The recovery is now approaching confluent downtrend resistance at the median-line near 65.62-66.31- a region defined by the 2020 high and the 2023 close low. Looking for a reaction off this pivot zone IF reached with a breach / close above needed to suggest a more significant low is in place.
Oil Price Chart – WTI Daily
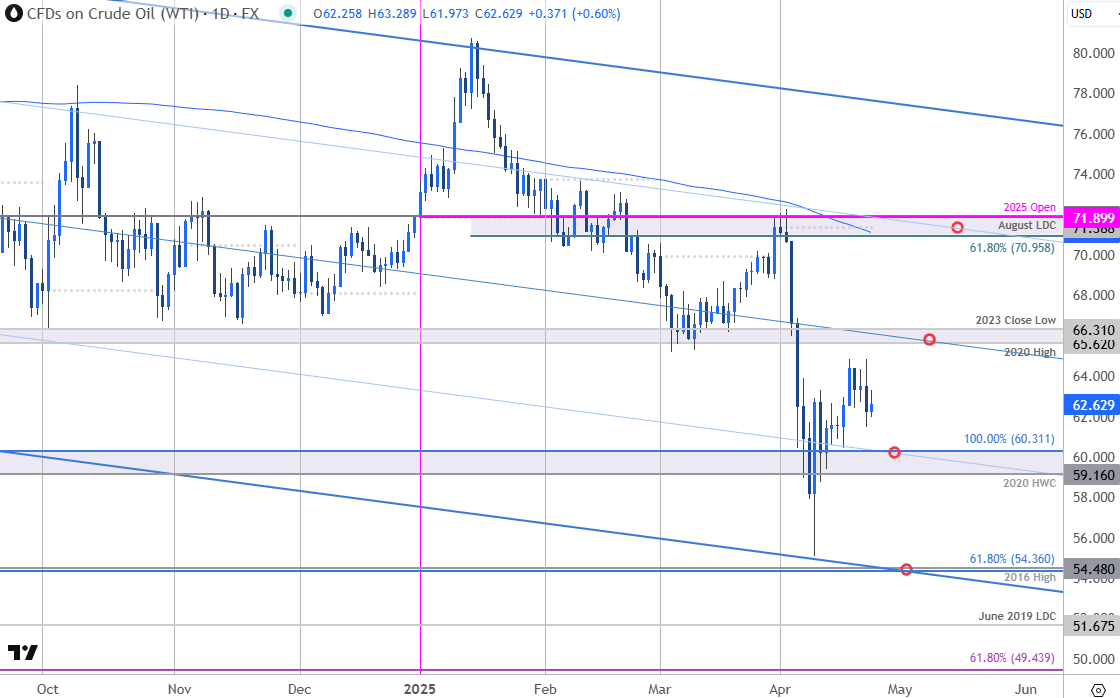
Chart Prepared by Michael Boutros, Technical Strategist; WTI on TradingView
A look at the WTI daily chart highlights the magnitude of the monthly decline and recovery. Daily support rests with the 2020 high-week close (HWC) / 100% extension of the 2023 decline at 59.16-60.31- a weekly close below this threshold would be needed to mark downtrend resumption towards the 61.8% extension of the 2022 decline / 2016 high at 54.36/48 (look for a larger reaction there IF reached). Subsequent support objectives seen at the June 2019 LDC at 51.68 and the 61.58% retracement of the 2020 rally at 49.44.
Oil Price Chart – WTI 240min
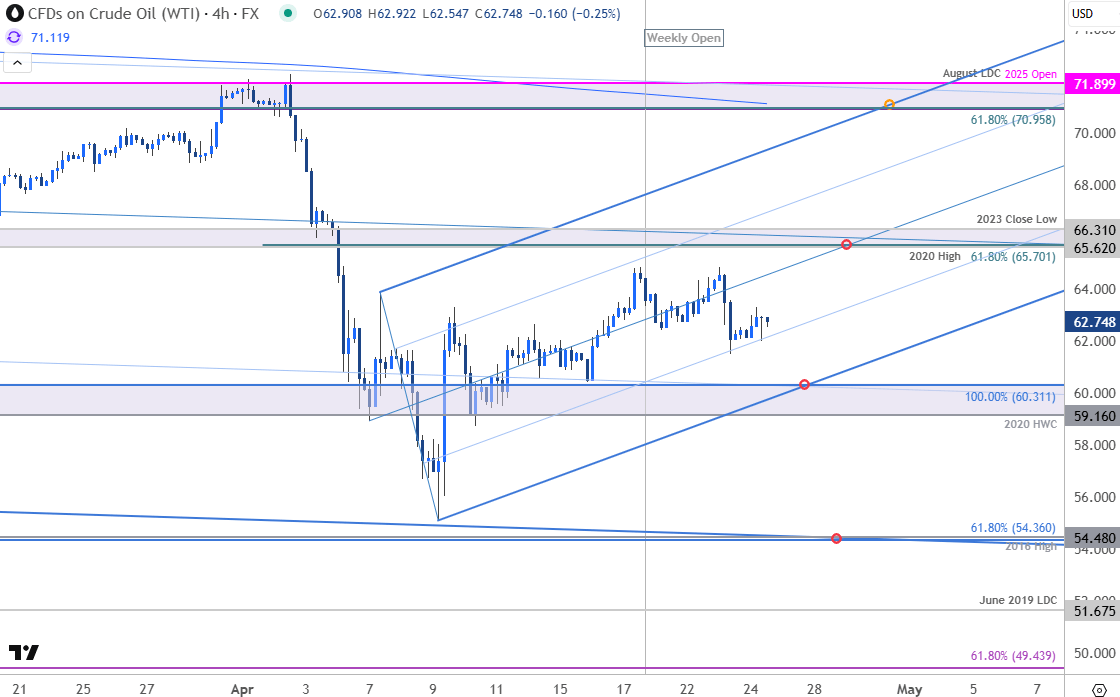
Chart Prepared by Michael Boutros, Technical Strategist; WTI on TradingView
A closer look at oil price action shows WTI trading within the confines of a proposed ascending pitchfork extending off the monthly lows with the 25% parallel offering support today. The weekly opening-range remains preserved heading into Friday and the immediate focus is on a breakout here for near-term guidance.
A breach / close above the 66.31 would expose the next major technical consideration at 70.96-71.90- a region defined by the 61.8% retracement of the yearly range, the 200-day moving average, the August low-day close (LDC) and the 2025 yearly open. Strength beyond this threshold would be needed to suggest a larger trend reversal is underway.

Bottom line: Oil has rebounded off trend support with the recovery now approaching downtrend resistance- risk for topside exhaustion / price inflection into 66. From a trading standpoint, losses would need to be limited to 59.16 IF oil is heading for a larger recovery on this stretch with a close above the median-line needed to fuel the next leg of the advance. Ultimately, a larger rebound may offer more favorable opportunities closer to trend resistance. Watch the weekly close for guidance here.
Active Weekly Technical Charts
- Australian Dollar (AUD/USD)
- British Pound (GBP/USD)
- Canadian Dollar (USD/CAD)
- Euro (EUR/USD)
- US Dollar Index (DXY)
- Japanese Yen (USD/JPY)
- Gold (XAU/USD)
- S&P 500, Nasdaq, Dow
--- Written by Michael Boutros, Sr Technical Strategist with FOREX.com
Follow Michael on X @MBForex
Latest market news
September 18, 2025 02:48 PM
June 23, 2025 01:22 PM
June 23, 2025 10:39 AM
June 20, 2025 05:23 PM
June 20, 2025 04:46 PM
June 20, 2025 03:35 PM

June 18, 2025 07:38 PM

June 18, 2025 03:24 PM
June 16, 2025 03:30 PM

June 12, 2025 04:08 PM