

FOMC, USD Talking Points:
- Tomorrow brings a Fed rate decision and this one comes with no updated projections from the bank, meaning the focus will be on the statement and then the press conference with Chair Powell at 2:30 PM ET.
- The USD has pulled back so far this week, holding the resistance at 100.22 after last week’s rally. There remains a short-term sequence of higher-highs and lows but given the proximity to long-term lows, we can’t rule out another effort from bears to poke at a fresh low.
- In the webinar, I went over some backdrops that I find attractive for each scenario in USD and I touch on some of the high points below. To join next week’s webinar as it happens, click here for registration information.
The US Dollar hit some long-term support in April and so far, that’s held the lows. But as I’ve been talking about on webinars since the oversold reading showed on the weekly chart of DXY, turns of that nature can take time. It’s sort of like trying to reverse course for a cruise ship in the middle of the ocean, and we can look to the two prior instances of oversold RSI on the weekly chart of DXY to illustrate that.
Last year, sellers pushed for five weeks after the indicator went into oversold territory. And in the previous case, a pullback showed after the first oversold RSI reading but sellers pushed a fresh low five months later. But the divergent RSI indication from that then led to a massive rally – and that low still hasn’t been taken out seven years later.
RSI is not great for timing although it can be fantastic context, in that it shows a heavy one-sided bias in a market. That can make chasing the market in that direction a more difficult prospect and, eventually, that can lead to a reversal. So far in the USD, we have stalling at support and only shorter-term indications of growing strength, with tomorrow’s FOMC rate decision as the next major driver for the matter.
U.S. Dollar Weekly Price Chart
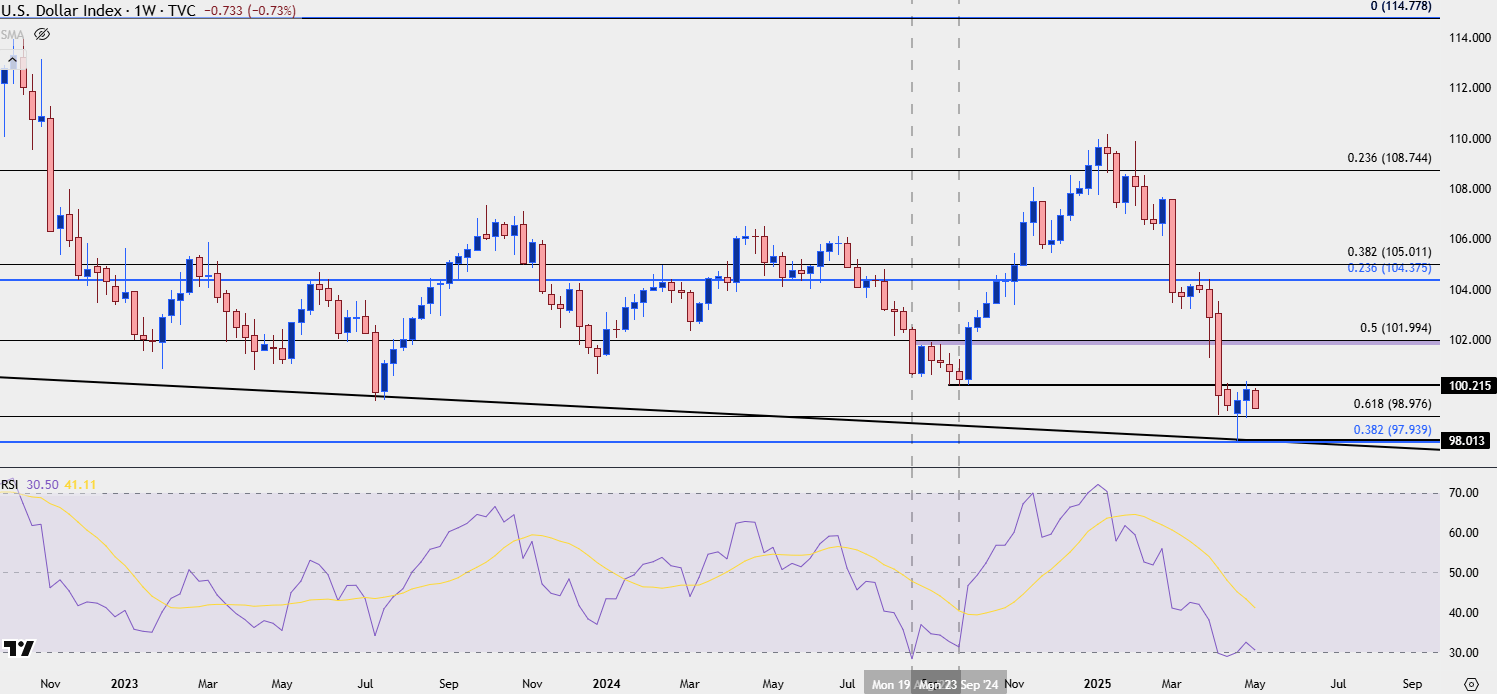 Chart prepared by James Stanley; data derived from Tradingview
EUR/USD
At this point EUR/USD bulls have hung on to support at 1.1275. The bigger question is whether they’re able or ready to drive a breakout beyond 1.1500. If we do see that push to a fresh high fail, then we could be working with a divergent RSI episode, like what showed on the other side of DXY last year. And if sellers can hold a lower-high, then the next support at 1.1200 opens the door for a test of a lower-low.
EUR/USD Daily Price Chart
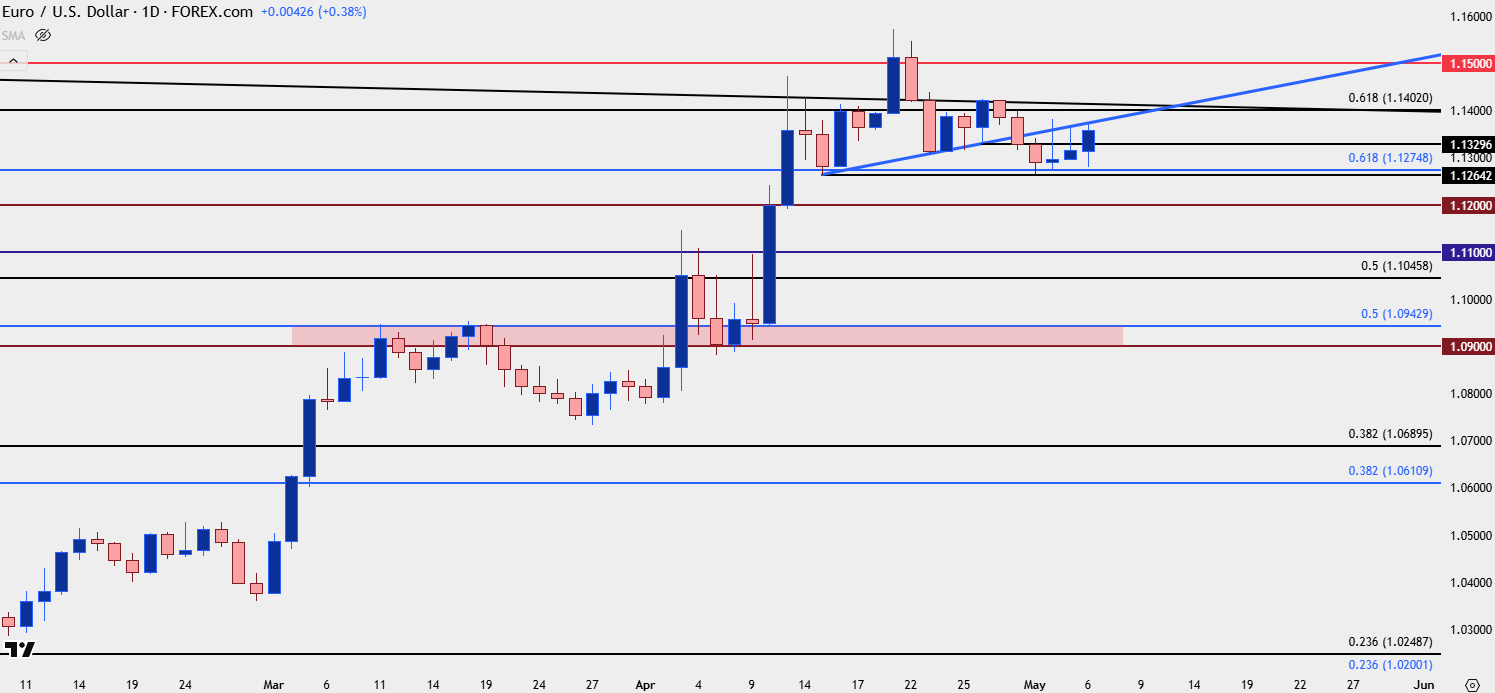 Chart prepared by James Stanley; data derived from Tradingview
EUR/USD Weekly
The weekly chart for EUR/USD remains intriguing for the swing backdrop, as there’s now been four consecutive weeks of resistance at 1.1400, with last week showing both a lower-low and a lower-high.

EUR/USD Weekly Chart
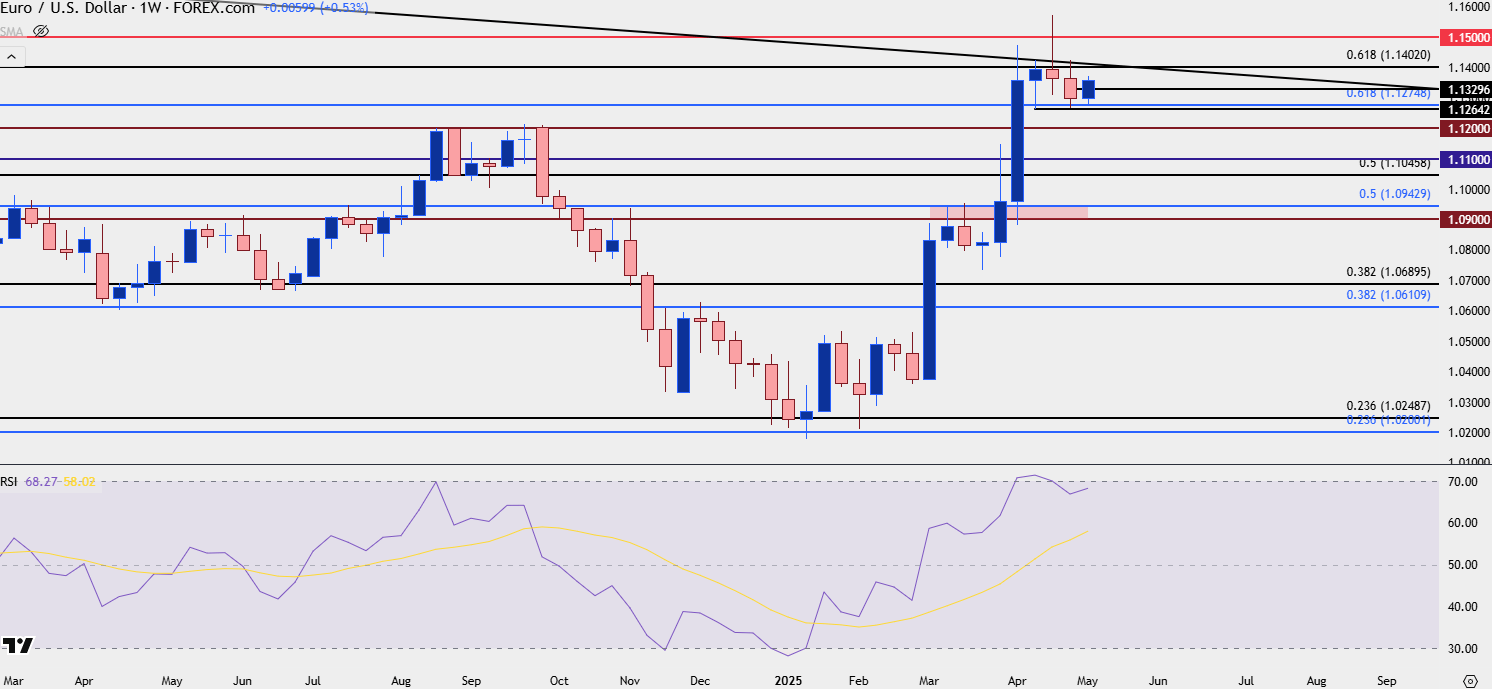 Chart prepared by James Stanley; data derived from Tradingview
USD/JPY
USD/JPY rallied aggressively after the Bank of Japan meeting last week, with a charge through the 145.00 handle until eventually, resistance showed at the underside of a longer-term trendline. Since then, however, bears have been on the prowl and price hasn’t been able to hold up for long, with 145.00 resistance showing at last week’s close and this week’s open, and sellers have continued to push down towards a prior swing-low of 142.05.
At this point, I’d be cautious of chasing the move lower as USD/JPY has had a penchant for brewing traps this year. A hold of higher-low support would keep the door open for a bounce setup, with 144.00 as the next clear area of resistance. This market will likely be a key market to watch for the FOMC meeting as the recent series of higher-highs and lows has been instrumental in the USD trying to rally over the past couple of weeks.

USD/JPY Daily Chart
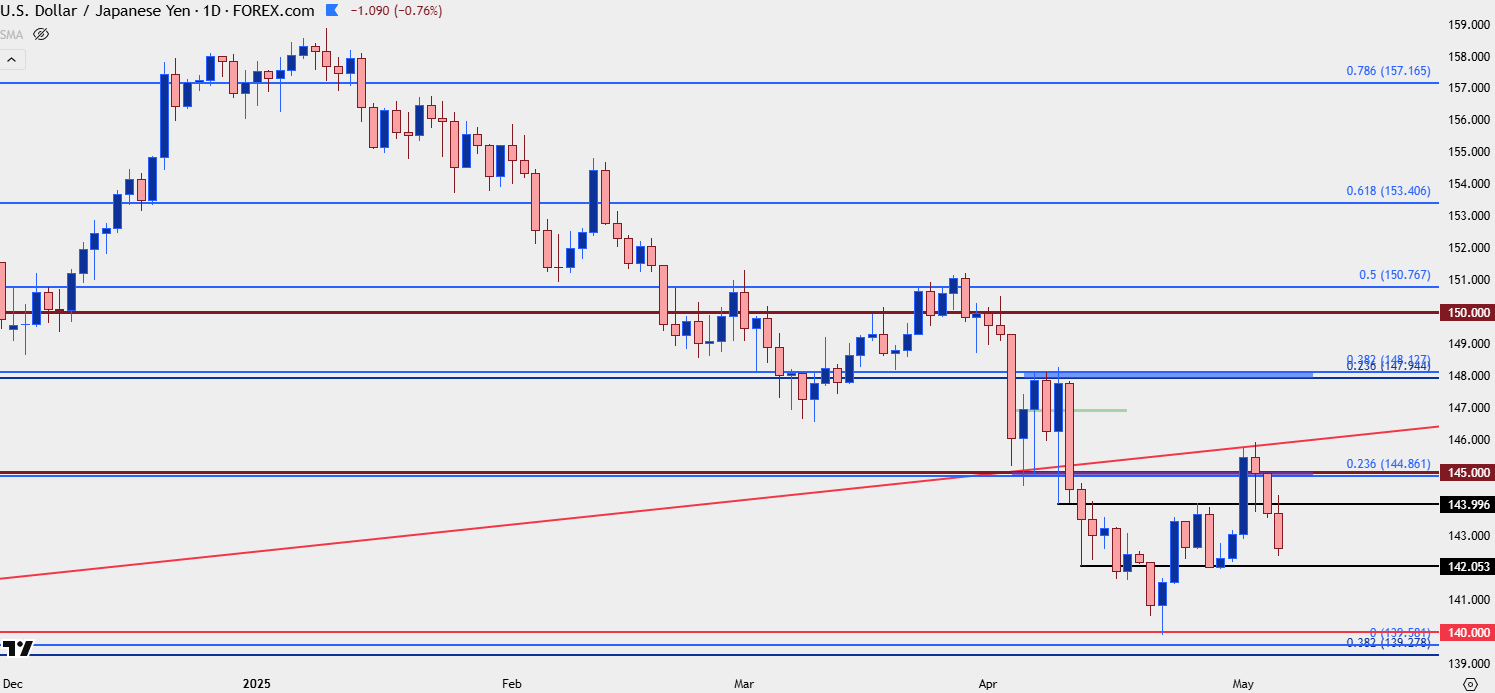 Chart prepared by James Stanley; data derived from Tradingview
--- written by James Stanley, Senior Strategist
Latest market news
September 18, 2025 02:48 PM
June 23, 2025 01:22 PM
June 23, 2025 10:39 AM
June 20, 2025 05:23 PM
June 20, 2025 04:46 PM
June 20, 2025 03:35 PM

September 18, 2025 02:48 PM

June 18, 2025 08:37 PM
June 13, 2025 06:22 PM

June 12, 2025 03:40 PM