
US Dollar Talking Points:
- There’s no clear evidence yet that the USD has bottomed but potential for a turn has started to show, with tomorrow’s FOMC rate decision a key driver for USD-pairs.
- Gold has continued to fly above $3k and that remains a hot button, but for USD markets, it’s EUR/USD’s proximity to 1.1000 and GBP/USD nearing 1.3000 that’s of interest. USD/JPY is also in the spotlight as the pair will see rate decisions from the Bank of Japan tonight and then the Fed tomorrow. As looked at yesterday, despite a consistent sell-off in USD/JPY there’s been a failure from bears to show breakouts upon tests of lows and this puts the focus on lower-high resistance potential.
Will the FOMC step on the Fed put at tomorrow’s rate decision? That’s the big question ahead of the March Federal Reserve meeting.
While there’ve been numerous risk off moves that have been softened by a dovish Fed, or, in some cases, a less-hawkish Fed, there seems legitimate fear that the bank may take a harder line here. If we even draw back to the 4th quarter of 2022, when inflation remained extremely high in the U.S., it was a FOMC that was drawing back on rate hike expectations that helped equities to turn from their lows.
A few months later, a regional banking crisis in the U.S. saw the bank sound even less interested in rate hikes and, instead, they started talking up the prospect of cuts when inflation was finally subdued.
By later in the year, the Fed was already forecasting cuts for 2024; and even in the first half of last year, as CPI remained elevated and questions were rightfully asked as to whether the FOMC would be able to loosen rates, FOMC members continued with a dovish refrain that kept stocks coursing higher and the USD pushing-lower, with DXY setting a fresh multi-year low in September of last year.
But now there’s a new concern to take into account and that’s the prospect of tariffs. The Fed has previously said that they expect that tariffs could boost inflation and there’s also the worry or risk that they could hit growth. It was the Atlanta GDP Now indicator plummeting earlier in March that really started to drive the concern as there’s recession fears entering the mix, and a recessionary backdrop in growth to go along with higher levels of inflation could put the Fed in a peculiar spot, where they might not be able to counteract economic weakness with loose monetary policy.
But, for tomorrow, the focus is on the Fed’s projections and how they expect this all to play out.
In the U.S. Dollar, the technical backdrop has started to resemble last September, which was around the last time that daily RSI had moved into oversold territory for DXY. The oversold reading was actually in August, and RSI divergence built through September as price action set up a falling wedge formation; but it was the breakout from that wedge that led into the massive USD-trend that ran through the New Year open.
That trend is now unwinding and March has been especially harsh for USD-bulls, as recession fears have taken a toll with the currency driving down to fresh lower-lows and lower-highs. As I said in the webinar, there’s no clear evidence that the USD has bottomed yet, but perhaps the more intriguing item is if sellers fail to show continuation around the FOMC rate decision tomorrow. An elongated underside wick could start to set the stage for turn potential in DXY and that would likely need some help from one of the markets looked at below.
US Dollar Daily Price Chart
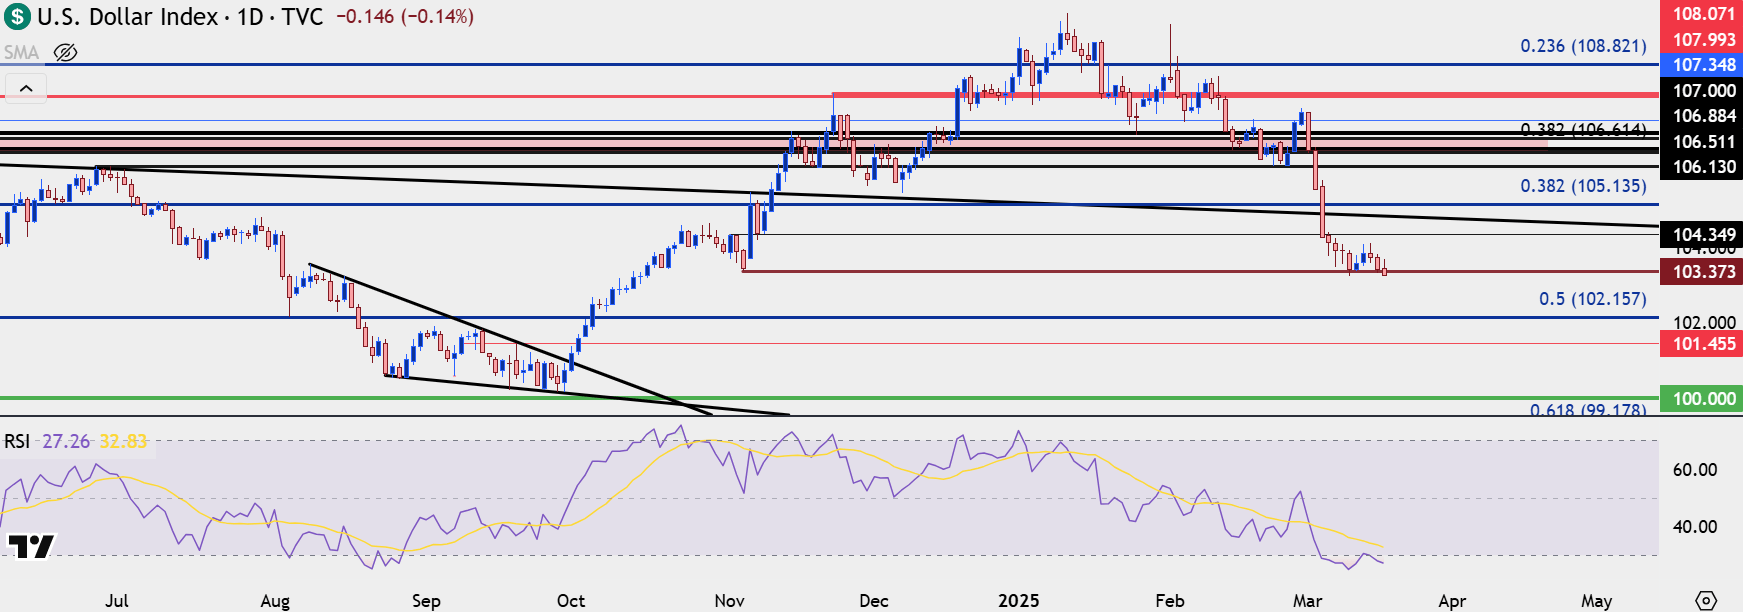 Chart prepared by James Stanley; data derived from Tradingview
EUR/USD
But that breakout didn’t come out of nowhere, as it was a grinding month of February that offset bearish drive and eventually allowed for the reversal.
The question now is whether bulls can continue the push through the 1.1000 handle. Just as USD is showing oversold readings on the daily above, EUR/USD is showing overbought readings on the daily below. And while oversold or overbought aren’t great for timing, they do deliver some important context, as it can be more difficult for bulls to chase an already overbought market, especially as a big area of resistance is nearby.
At this stage there’s no clear evidence of a top being in-place in EUR/USD. But depending on how markets treat that 1.1000 level around the FOMC rate decision tomorrow, something like that could present itself. As shown in the webinar, there’s quite a bit of prior support structure that bears will need to contend with to take control of the matter, such as the 1.0943 Fibonacci level that’s in-play right now, or the 1.0909 Fibonacci extension or the 1.0865 Fibonacci level below that.

EUR/USD Daily Chart
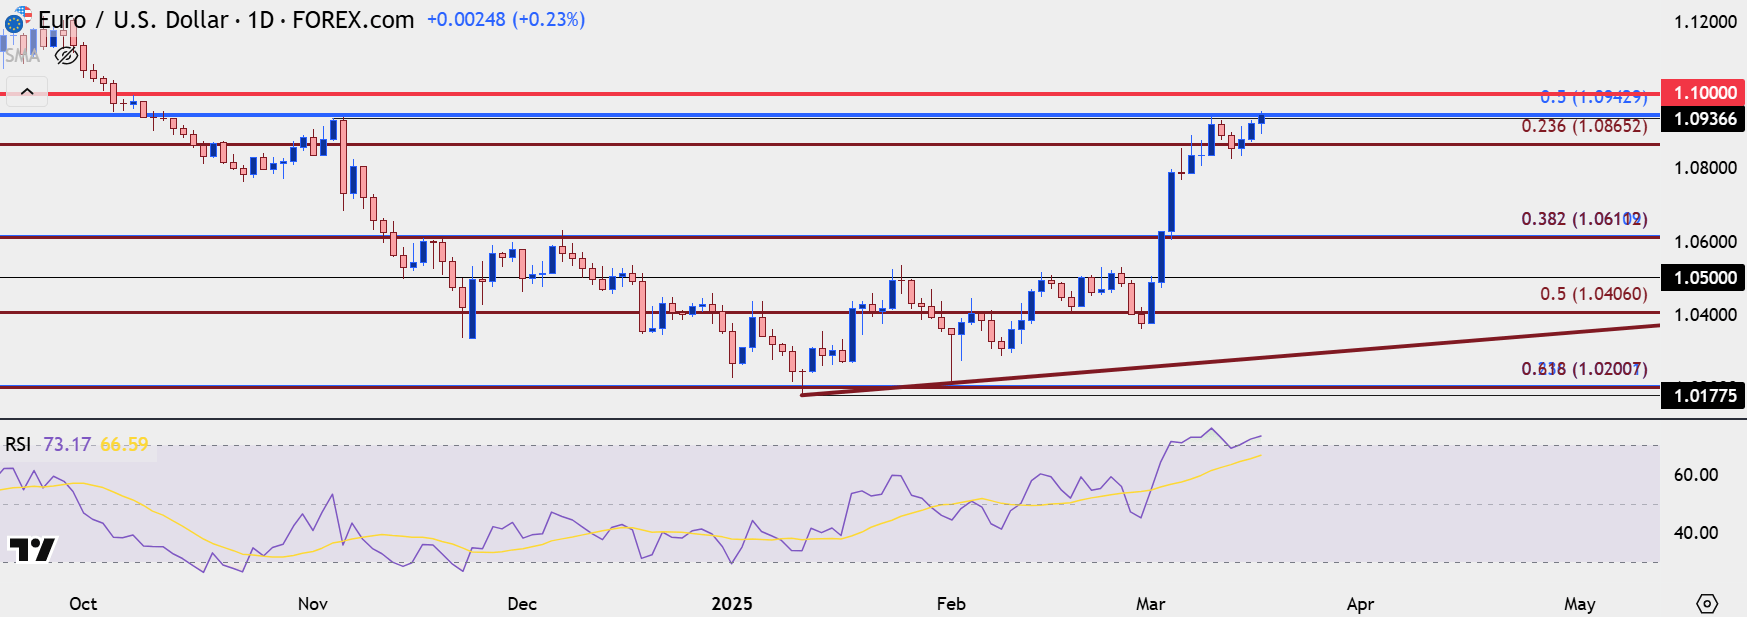 Chart prepared by James Stanley; data derived from Tradingview
USD/JPY
While there appears to be remaining interest for bears on the fundamental side, the fact of the matter is that price action doesn’t match that, so the question must be asked as to why. That’s not necessarily a ‘new’ thing though, as it’s been a consistent sell-off in the pair this year, but sellers have continually been thwarted upon tests of fresh lows.
So, caution should continue to be exercised around breakdown strategies, while lower-high resistance can remain of interest. From the four-hour chart below there remains a structure of higher-highs and higher-lows, and there’s deeper long-term resistance potential at Fibonacci levels above 150.00 and 150.77, 151.51 and then the 151.95 swing, which is now confluent with the 200-day moving average.

USD/JPY Four-Hour Chart
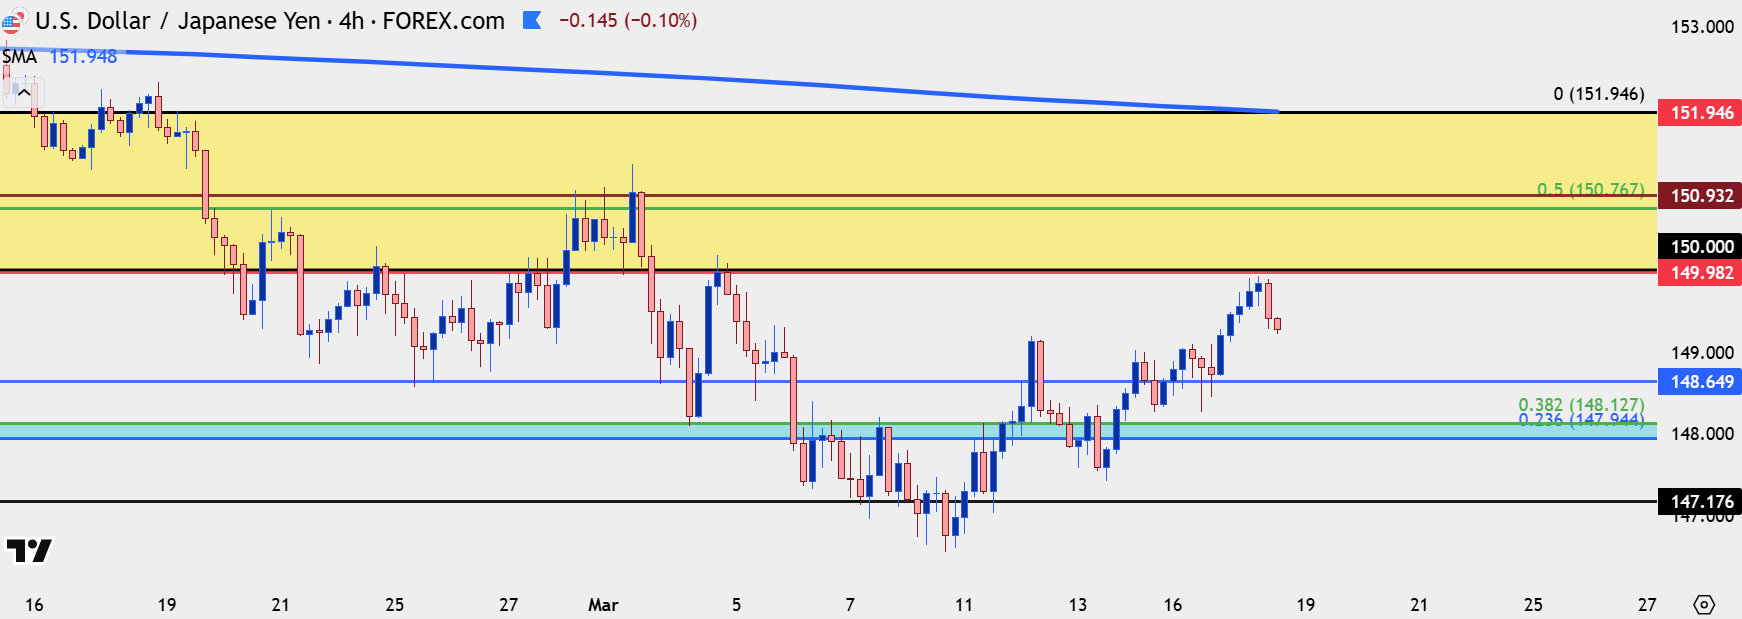 Chart prepared by James Stanley; data derived from Tradingview
Gold
Gold bulls are continuing to drive and the past 24 hours has shown an element of resistance-turned-support at the $3k psychological level. So far this week price action has been fairly clean, with support at prior resistance, around 2982, followed by an ascending triangle into a higher-low at 2994, which was then followed by breakout and an overnight now around the $3k level.
Given FOMC tomorrow, the potential for volatility remains high but as I said in the webinar, I’d hesitate to get bearish here because there’s no sign yet that bulls will relinquish the reins.
Given the lack of historical price action around current levels, round numbers become of interest for both support and resistance. The $3050 level is now the next big spot for short-term resistance, followed by $3100 for bigger picture resistance. On a shorter-term basis, 3030 and 3020 are of interest for higher-lows provided some evidence of support at those prices. If those can’t hold, 3010 and 3k become of interest for something similar.
And if bears can elicit a push below the 2982 swing, there’s an open door to run down towards 2950 as there was a very quick breakout between those two prices.

Gold Hourly Price Chart
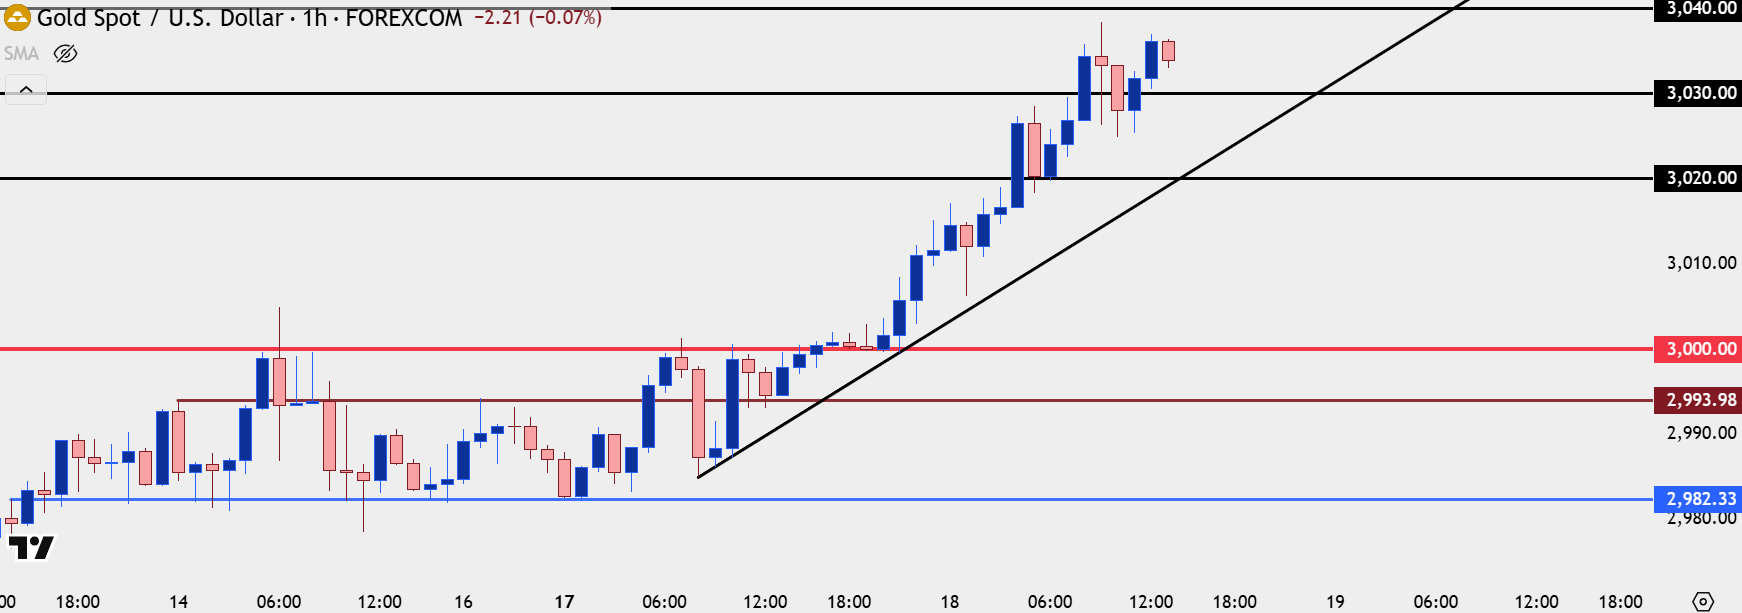 Chart prepared by James Stanley; data derived from Tradingview
--- written by James Stanley, Senior Strategist
Latest market news
September 18, 2025 02:48 PM
June 23, 2025 01:22 PM
June 23, 2025 10:39 AM
June 20, 2025 05:23 PM
June 20, 2025 04:46 PM
June 20, 2025 03:35 PM

June 20, 2025 05:23 PM

June 20, 2025 12:21 PM

June 20, 2025 05:20 AM

June 20, 2025 12:39 AM