
FOMC, USD, U.S. Dollar Talking Points:
- The USD broke down to a fresh three-year low this week after lower-than-expected CPI and PPI prints. This increased expectations for rate cuts later this year, but the big question now is whether the Fed will agree with that scenario.
- There’s little expectation for any actual rate changes at next week’s meeting, but it’s a quarterly meeting which means the bank will issue updated guidance and projections, highlighting their expectation for the future path of interest rates. This will probably be the big driver.
- To date, the Fed has been cautious in talking up rate cuts and they’ve cited the possible inflationary impact of tariffs. But there’s also the re-flare of inflation last year after the Fed started cutting rates which has since calmed.
- I’ll be looking at the US Dollar from multiple pairs in the FOMC preview webinar on Tuesday, and you’re welcome to join. Click here to register.
U.S. Dollar bears remain in control as we move into the second-half of June trade, and a below-expected batch of inflation prints last week helped sellers to push down to fresh 2025 lows. The focus now moves on to the major driver of the Federal Reserve and this is where the proverbial rubber meets the road. Markets continue to expect the Fed to cut rates later this year, with at least 50 bps of cuts priced into a current probability of 66.7%. There’s currently a mere 6.3% probability show for no cuts this year and if this highlights a possible area of divergence in the market, with a Fed that’s been cautious to talk up rate cuts given the opaque backdrop around tariffs.
Rate Cut Probabilities into EOY 2025, per CME Fedwatch
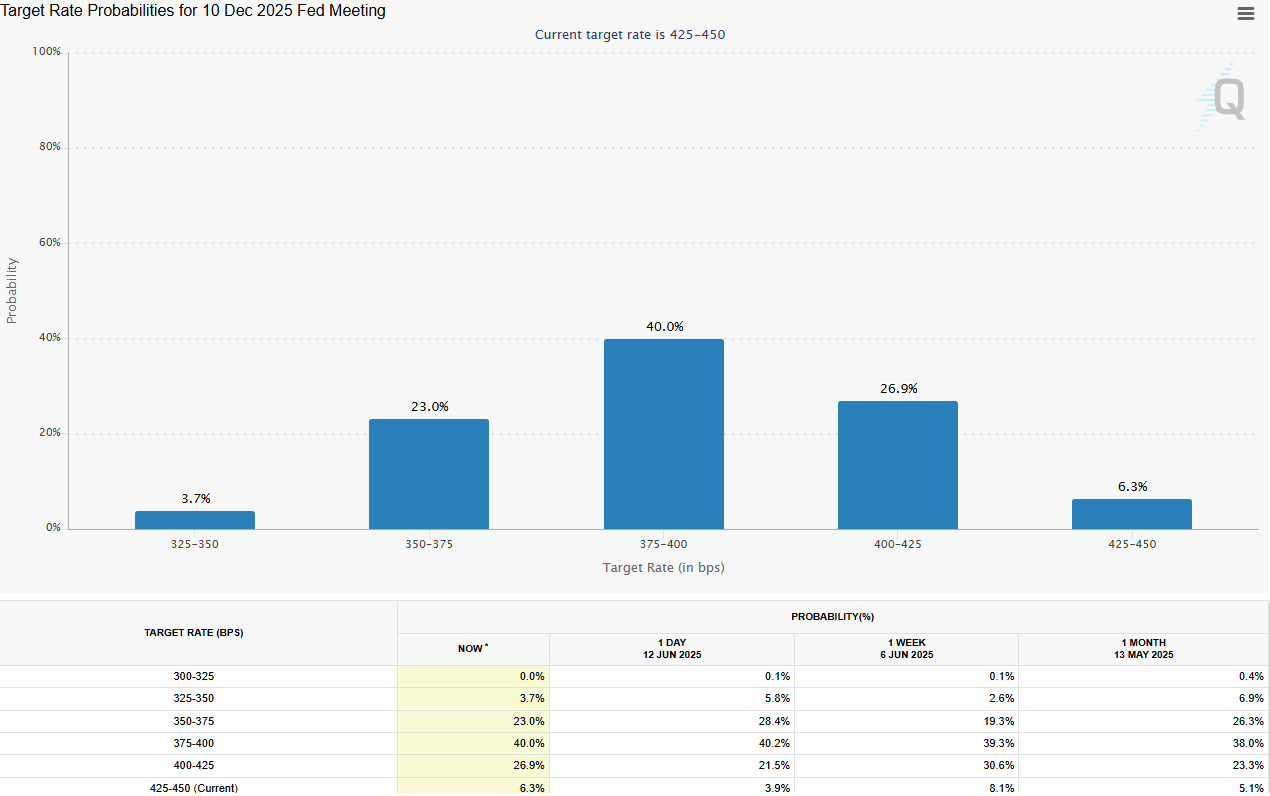 Chart prepared by James Stanley; data derived from CME Fedwatch
Despite the general slowing in economic data out of the U.S. so far this year, which has pushed along those rate cut expectations, the Fed has been noticeably hawkish, instead continually saying that the potential for inflation for tariffs demanded a neutral stance.
In the three rate decisions so far this year, the immediate response in the USD has been strength, with rate decision announcements on January 29th, March 19th and May 7th all leading into short-term rallies in the USD.
Those rallies couldn’t sustain, however, as sellers merely showed up after a print of a lower-high and then continued the trend down to fresh lows. Each of those meeting announcement days are marked on the below chart with a black vertical line.
U.S. Dollar Daily Chart
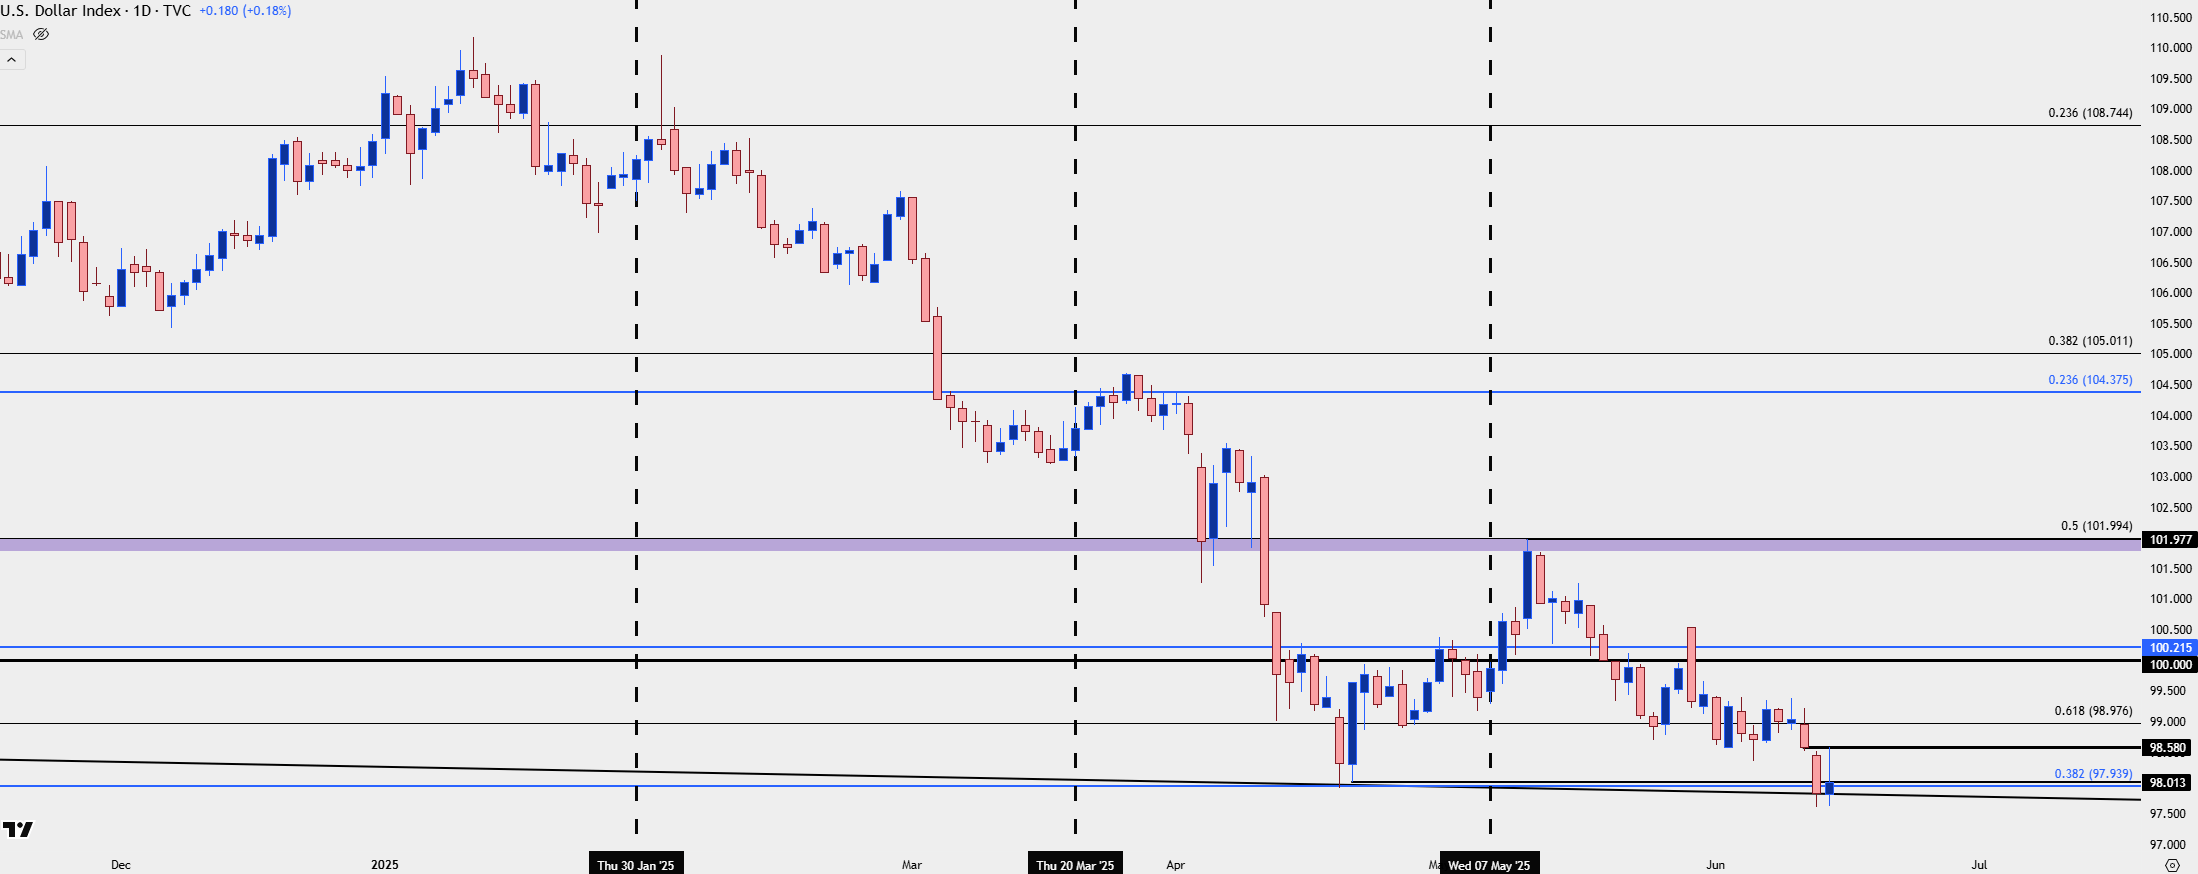 Chart prepared by James Stanley; data derived from Tradingview
Chasing Oversold v/s FOMC Projections
The big question now is whether the Fed will signal oncoming rate cuts. With this being the June meeting, logically the Fed would need to highlight the potential for two cuts this year for the market to continue to price in a move in September. And if they don’t, the whittling down of those rate cut expectations could give reason for USD shorts to close positions, and given how aggressively that move has come on this year, there’s potential for a short squeeze type of scenario.
From the weekly chart, with a few hours until the conclusion of the week, RSI is teetering on the verge of oversold territory, showing right at the 30.00 level right now. But, perhaps more interesting is the relative positioning of the indicator, as that’s a higher-low than the reading produced in late-April, even though we have a lower-low on price. This would be an element of RSI divergence similar to what showed last year in Q3, just before the Q4 reversal in the U.S. Dollar.
This would require a move from bulls next week to formulate that higher-low in RSI and given that this is the Dollar, which is merely a basket of currencies, the big question there is whether other markets may be able to take on additional strength to drive more USD-weakness, which I’ll look at a little lower.
U.S. Dollar Weekly Chart
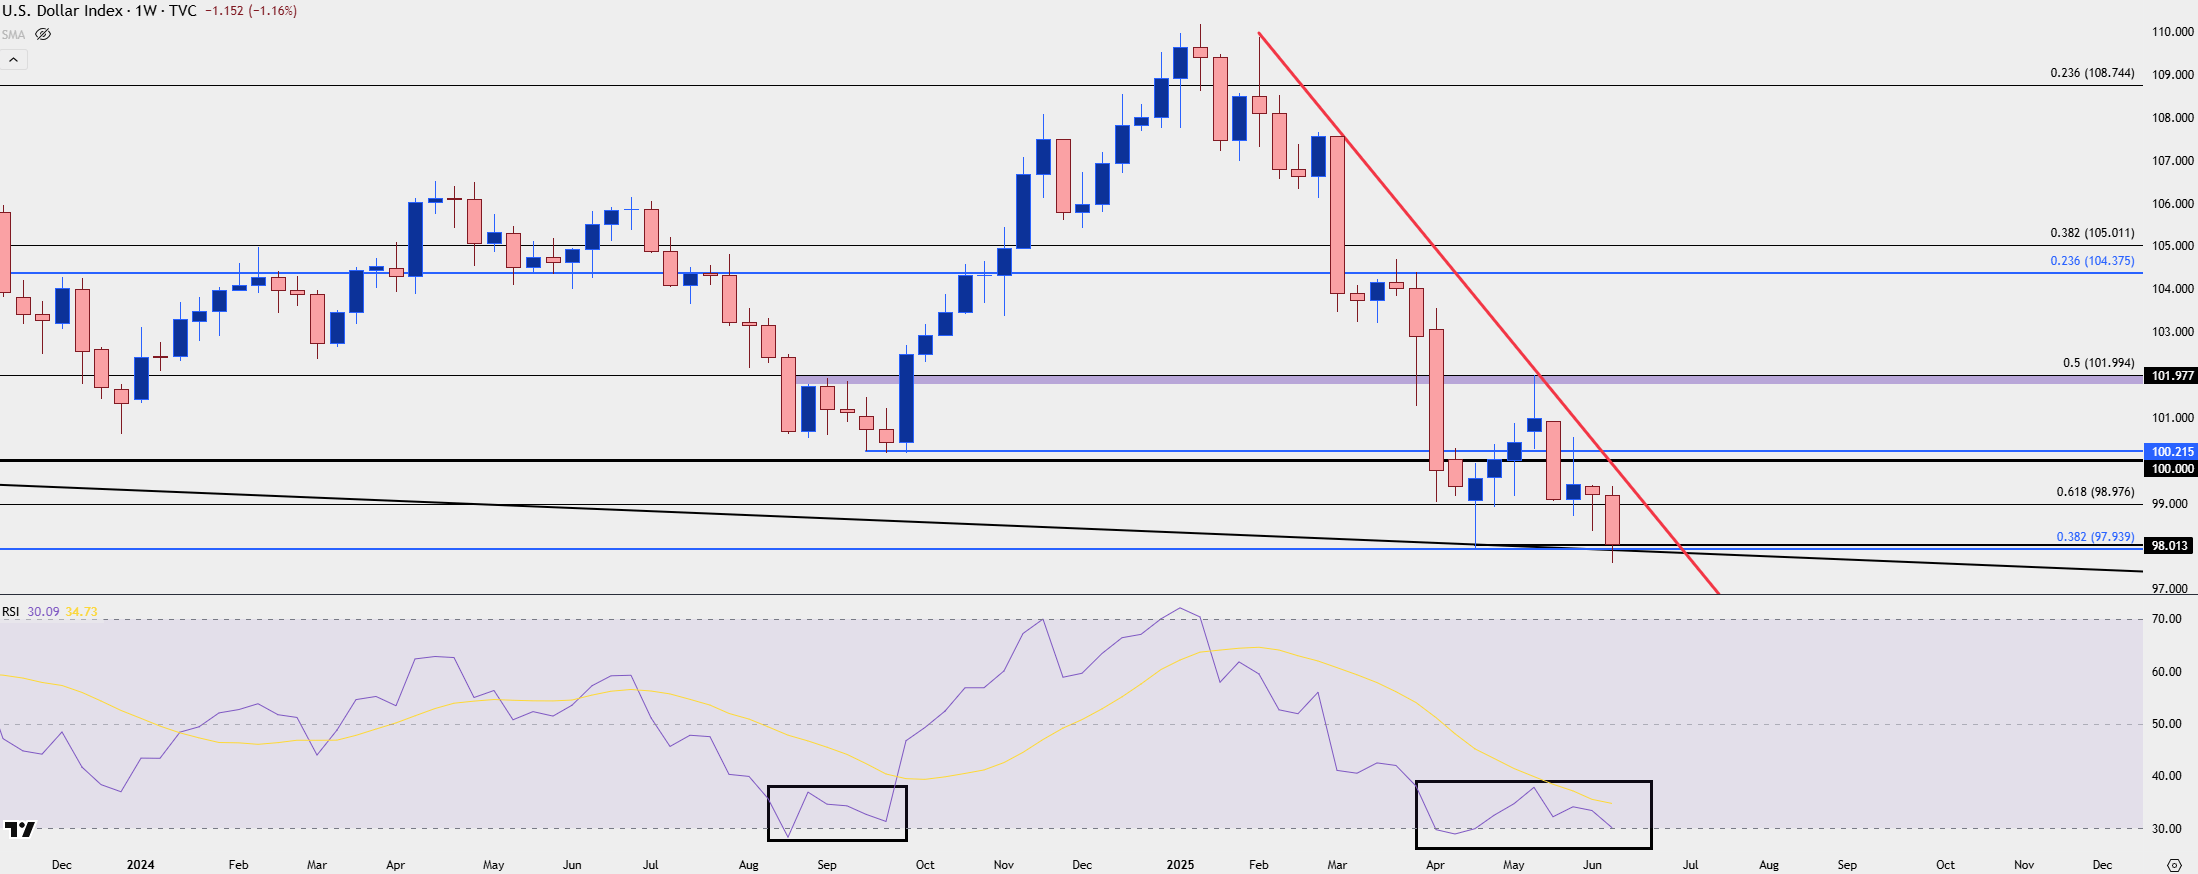 Chart prepared by James Stanley; data derived from Tradingview
EUR/USD
I looked into EUR/USD on Thursday after the breakout, and highlighted short-term support structure. The 1.1500 level stuck out as this was a prior spot of resistance that was now set up as support potential.
That came into play on Friday and led to a vigorous bounce, keeping the door open for bulls to retain control in the pair. Given that the Euro is 57.6% of the DXY quote, to keep the Dollar sell-off pushing EUR/USD bulls are likely going to need to remain at work. The weekly chart is now showing overbought conditions and that can produce a bit of a headwind there, but from the daily, as I shared in the Tuesday webinar before the breakout, price action retains a bullish lean and we can’t quite say that it’s setting up for reversal at this point.

EUR/USD Daily Chart
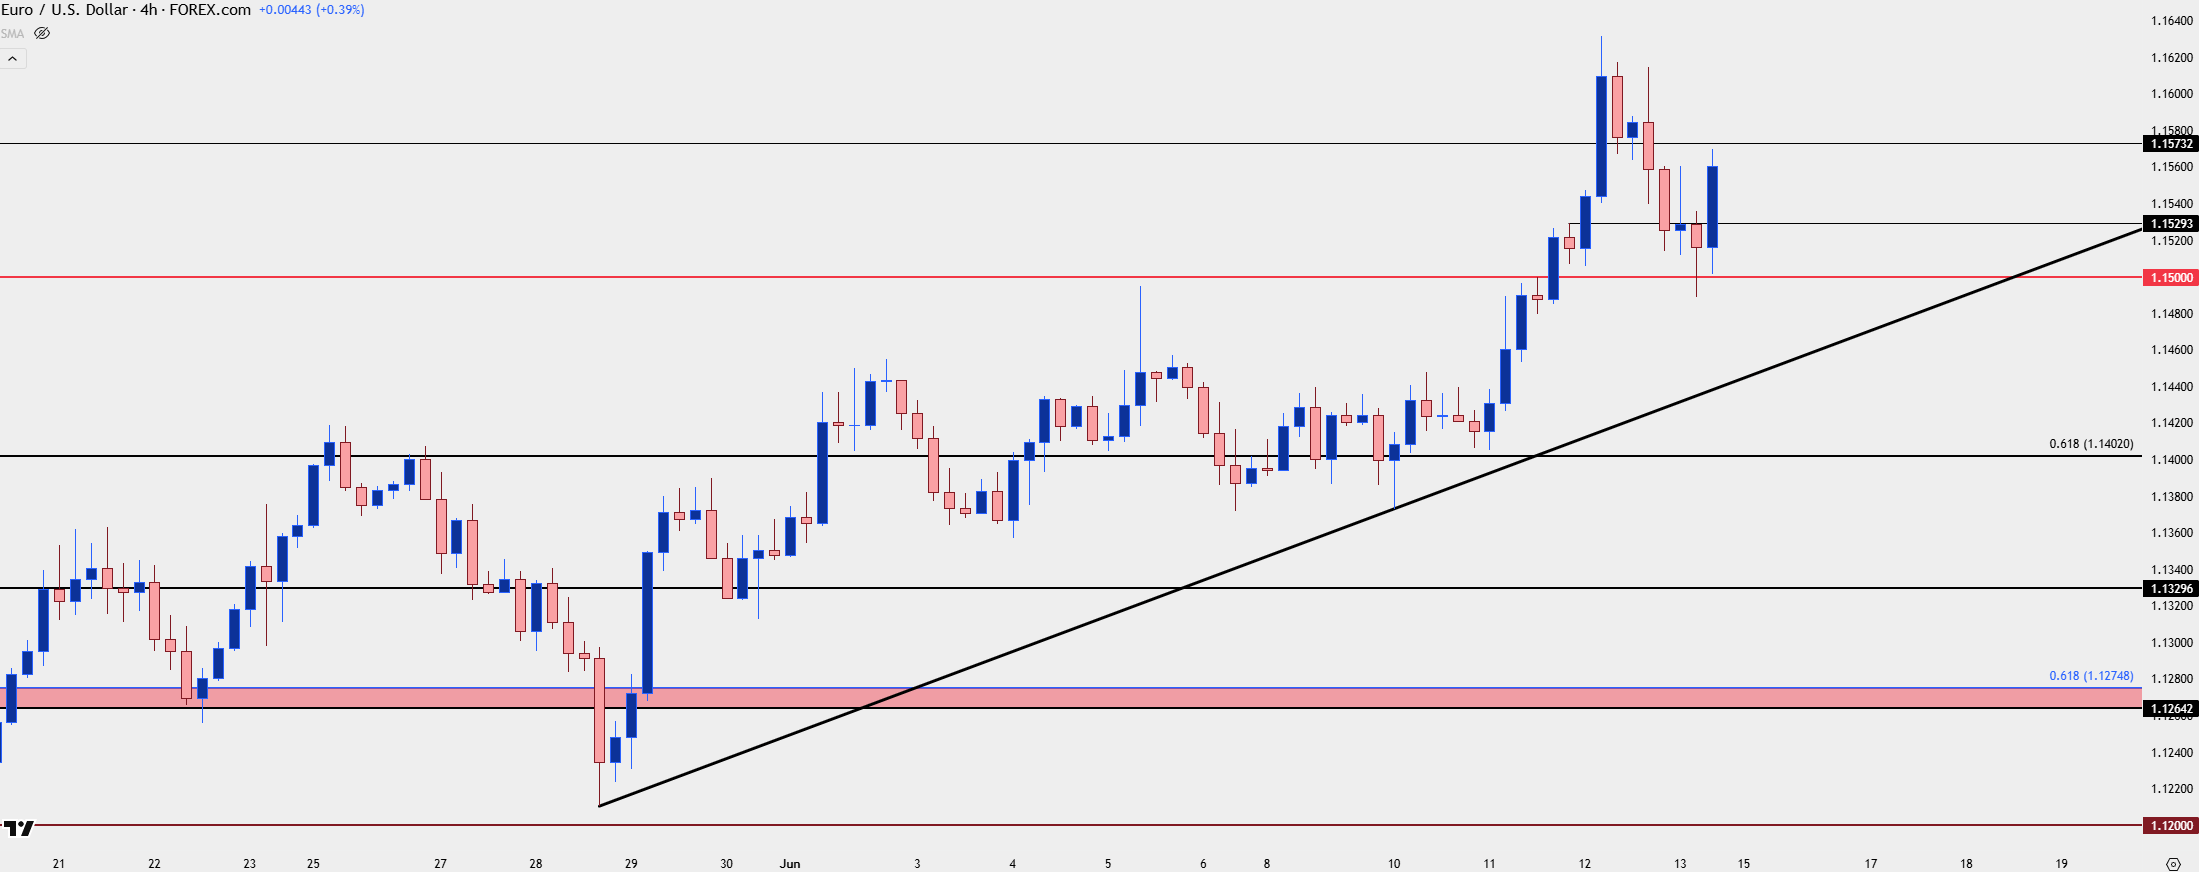 Chart prepared by James Stanley; data derived from Tradingview
EUR/USD Big Picture
With the ECB sounding less-dovish in the prior week at their rate cut, and the expectation for the FOMC to cut rates later this year, the divergence between the two central banks becomes an obvious point of interest for trends.
That ECB rate decision produced a breakout with price making a move up to the 1.1500 handle. The pullback from that held a higher-low, and then it was on the back of below-expected CPI and PPI this week that USD bears and EUR/USD bulls were able to drive ahead.
But now the matter moves on to the Fed, and if they FOMC does continue to sound relatively hawkish, whether its on the back of inflation expectations from tariffs or the fact that CPI has just moved up again on a YoY basis, there could be reason for EUR/USD bulls to take profits after the test of fresh three-year-highs.
And in a mirror image of what was looked at above on USD, there’s now an overbought reading on EUR/USD weekly, along with a possible case of divergence given the higher-high in price and the potential for a lower-high in RSI.
The overbought reading on the weekly chart makes it difficult to chase fresh breakouts, but as looked at above, there’s still the possibility for bullish trend continuation provided that the structure of higher-highs and lows remains intact.
EUR/USD Weekly Chart
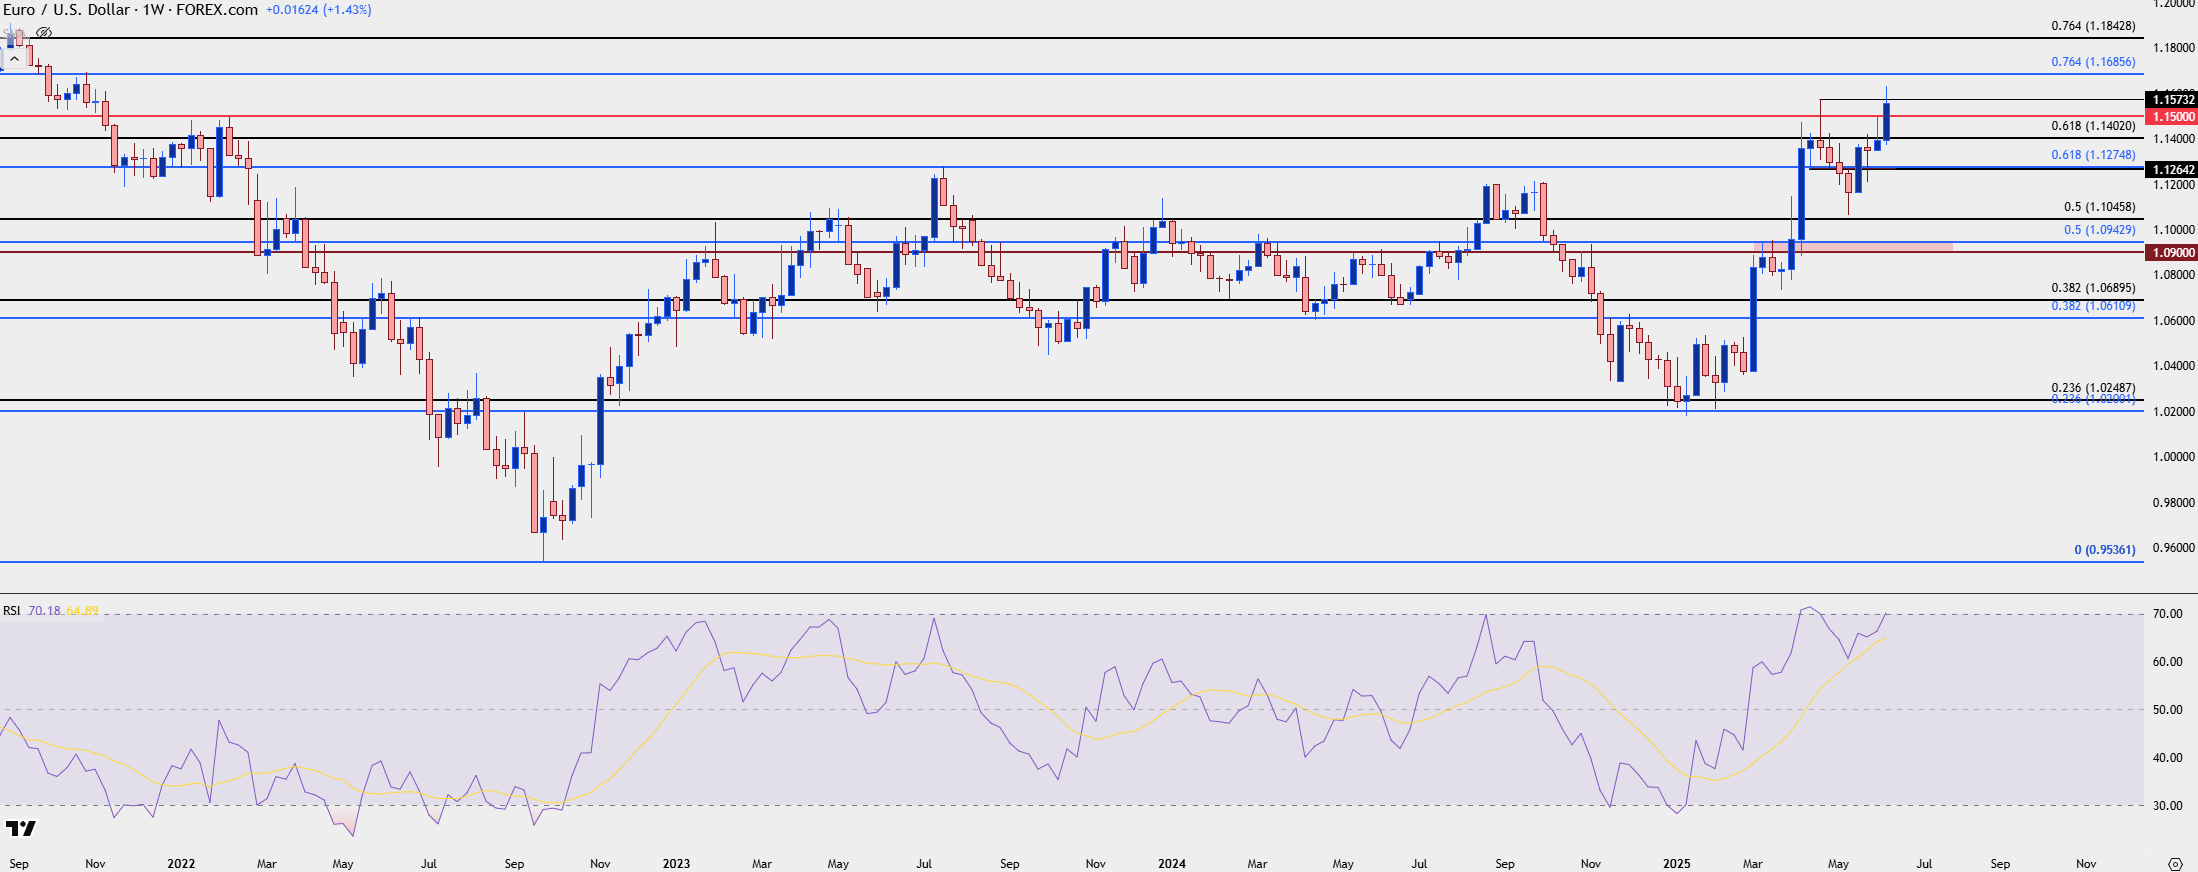 Chart prepared by James Stanley; data derived from Tradingview
USD/JPY
Even though the Yen is only 13.6% of the DXY quote, I still think that dynamics in the pair could be a larger push point for the USD, perhaps even more so than trends in EUR/USD. The reason for this is the long-term carry trade and as USD/JPY remains about 40% above the early-2021 levels, logically, there’s still a lot of that carry trade priced-in here.
As we saw Japanese yields rocketing higher earlier in the year, the desire to hold hedges on that carry was lessened, and this helped to drive USD/JPY lower until, eventually, the 140.00 level came into play.
More recently, there hasn’t been much for USD bulls to work with, given a generally slow slate of economic data; but at the meeting in May USD/JPY put in a strong move off support at 142.50, gaining more than 600 pips over the next few trading days. A rise in Japanese yields then erased a chunk of that move, but bulls came in to defend 142.50 in late-May and it’s been higher-lows ever since, including this week as USD broke down.
If the Fed signals rate cuts on the way, that could be motivation for carry traders to close hedges which could then lead to another push lower. But if the Fed echoes a relatively hawkish stance as they have for much of this year, we could see shorts squeezed with that 145.00 level set up as a major spot of short-term resistance in the pair.

USD/JPY Daily Chart
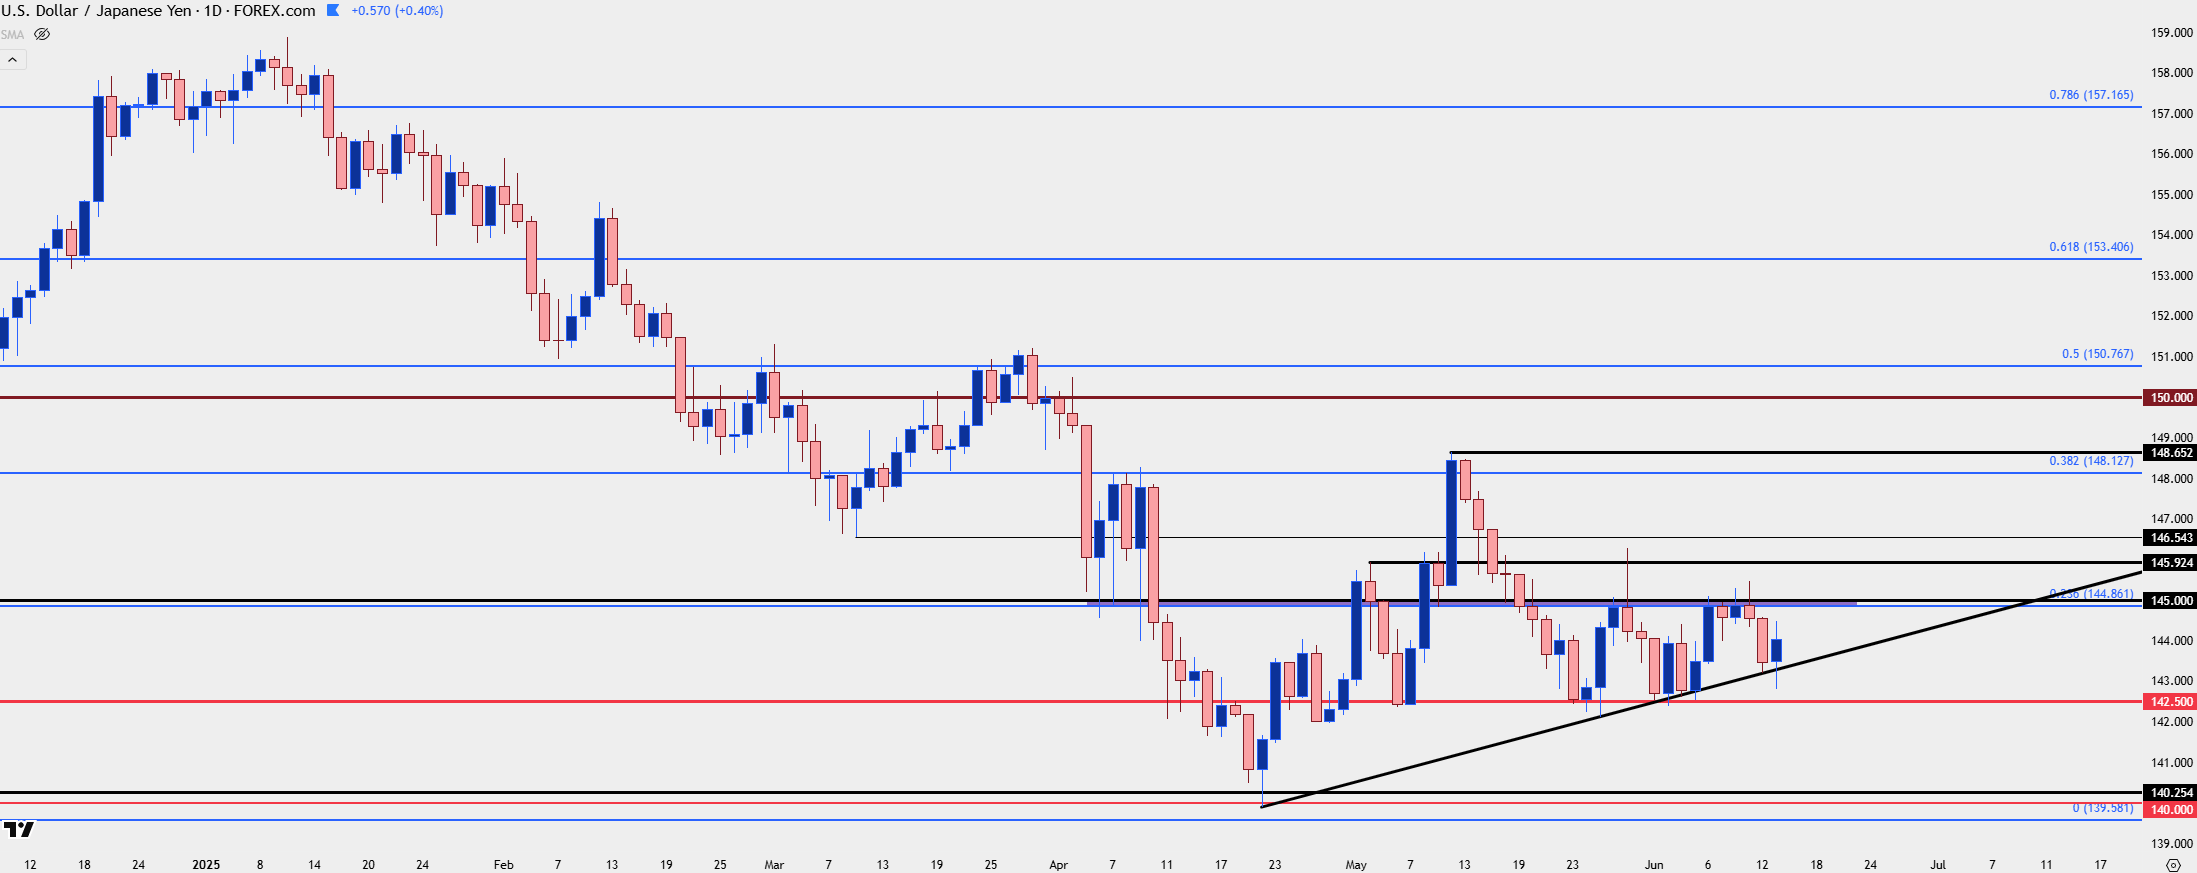 Chart prepared by James Stanley; data derived from Tradingview
--- written by James Stanley, Senior Strategist
Latest market news
September 18, 2025 02:48 PM
June 23, 2025 01:22 PM
June 23, 2025 10:39 AM
June 20, 2025 05:23 PM
June 20, 2025 04:46 PM
June 20, 2025 03:35 PM

September 18, 2025 02:48 PM

June 18, 2025 08:37 PM

June 18, 2025 04:35 PM

June 17, 2025 06:20 PM