

Shortly after the open, the S&P 500 found itself around 2% lower, while tech-heavy Nasdaq 100 and the small-cap Russell were even weaker. Stagflation concerns came to the forefront of investors’ minds as GDP and other US data came in weak, while inflation indicators were hot. Tariff turmoil forced several companies to pull their profit guidance. But at the time of writing, markets were coming off their lows. We had a weaker-than-expected core PCE price index (Fed’s favourite inflation measure) while pending home sales, personal income and spending all topped expectations. Traders were preparing to get earnings updates from major technology companies in the next couple of days, while also keeping an eye on more macro data from the US, with ISM manufacturing PMI and non-farm payrolls report both to come in the next couple of days. Although down noticeably today, the S&P 500 forecast is not fully bearish yet. This is because the Fed is now more likely to step in sooner with its rate cuts to support an ailing economy, while the weakness in data could also encourage Trump to ease off on tariffs and make deals, quicker.
Recession risk surges but this raises prospects of sooner Fed rate cuts
Recession risks are firmly at the forefront right now. Following today’s mostly weak data, Kalshi now places the probability of a US recession this year at 74%—a notable spike. Meanwhile, over on Polymarket, the odds of a recession have been bid up sharply, now sitting at 71%.
However, this also means the Fed will be more inclined to cut rate sooner, especially with Trump applying heavy pressure on the central bank to do so. Markets love rate cuts or expectations thereof, and for that reason we could see the S&P 500 forecast turning a bit more positive, especially if Trump simultaneously eases tariffs pressure.
Before reviewing today’s data and discussing factors to watch later in the week, let’s first talk technicals and look at the S&P 500 chart, as it tests a key support area…
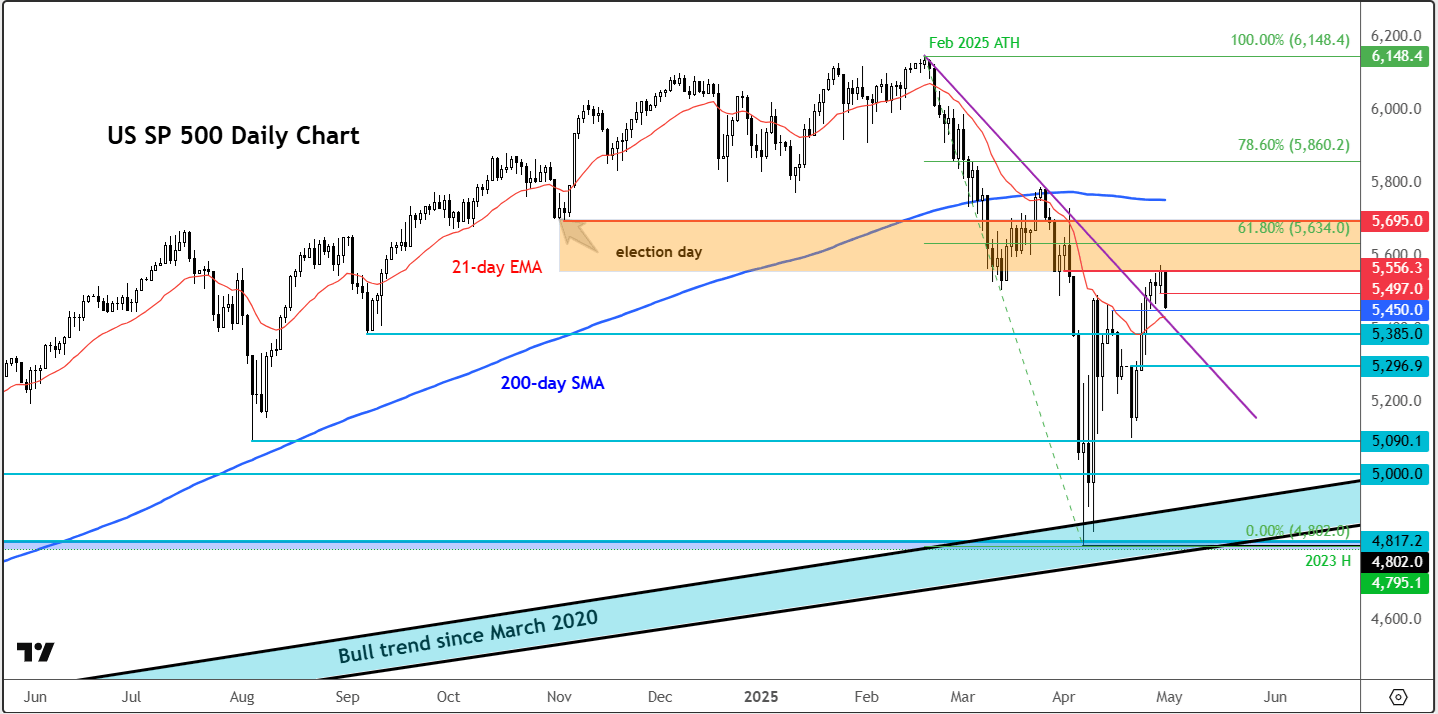
Technical S&P 500 forecast: Key levels to watch
Source: tradingView.com
After a sharp drop, the S&P 500 chart was testing the upper side of the broken bearish trend line that had been in place since markets topped in February. Once providing strong resistance, it could now turn into support. Additionally, horizontal support at 5450, or just below, was also being tested. Below these levels, 5385 and then 5296 are the next key levels of potential support.
In terms of resistance, 5497, marking the previous day’s low is an interim resistance level. Above that 5556 comes into focus next, a level that has held as resistance in the last 3 sessions. Above that, the next bullish targets include 5600, 5634 (marking the 61.8% Fibonacci level) and then 5695.
All told, the technical S&P 500 forecast, which turned moderately bullish following the trend break, remains intact – just about.

Grim GDP data highlights tariff related slowdown
Until the release of the just-released personal incoming and spending data, it has been a rather grim week for the US economy. Today’s earlier economic data came in decidedly soggy, with ADP report—measuring April’s private payrolls—being a proper let-down, printing a mere 147,000 jobs added, barely half of what was expected. That’s the weakest reading since last July, and to add insult to injury, it managed to undershoot every single economist’s forecast.
Then, we had the first estimate of US Q1 GDP, and it showed a 0.3% contraction, when markets were braced for a modest 0.2% expansion. Quite the contrast to the Eurozone, where growth actually ticked up by 0.4%—almost as if Europe briefly remembered how to function properly.
The real kicker? Inflation in that GDP report was hotter than expected: The GDP Price Index was 3.7% q/q compared to 3.1% expected.
The negative Q1 GDP reading might well have looked considerably worse were it not for a boost from inventories—an accounting quirk, really, as these represent unsold goods that nonetheless count towards the production of goods and services.
Strip that out, and the contraction boils down to just two culprits. First, trade: imports alone shaved a hefty 4.83 percentage points off growth, largely due to tariff front-running. Second, government spending, which subtracted 0.25%—marking the first time since 2022 that the public sector posted a negative contribution.
There were, however, a few positive signs, with Core PCE coming in flat month-on-month, while pending home sales surged 6.1%. Personal income (+0.5% m/m) and spending (+0.7%) m/m also beat.
But all told, the data was mostly negative and to put it plainly, the blame for the weakness appears to rest squarely on President Trump’s shoulders, with his policy decisions—particularly on trade—being the primary drag.
Looking ahead: Tech earnings, Trump speech and NFP
President Trump is due to pontificate on ‘investing in America’, and we’ve got earnings from Microsoft and Meta after the bell. A lot hinges on how these two tech giants perform. Apple and Amazon, tomorrow, could also offer big insights on consumer trends. Then the focus will turn to the April jobs report on Friday. One thing’s for certain: it’s going to be a very busy week. Buckle up.
-- Written by Fawad Razaqzada, Market Analyst
Follow Fawad on Twitter @Trader_F_R
Latest market news
Today 05:00 PM

Today 08:56 AM

Yesterday 08:22 AM

April 28, 2025 08:39 AM

April 25, 2025 11:45 AM