

Over the past two trading sessions, the S&P 500 has gained more than 5%, with the price now holding steadily above the 5,300-point level. This renewed bullish bias in the index has been primarily driven by recent comments from President Trump, which point to a possible easing in trade tensions with China. These remarks have brought renewed optimism to the market, strengthening buying pressure on the SPX in recent sessions. If the positive tone from the White House continues, market confidence may continue supporting the current bullish momentum.

The White House Shifts Its Tone
Not long ago, the United States had threatened to impose a 145% tariff on imports from China. In response, China announced reciprocal tariffs of 125% and restricted access to critical exports such as rare earth minerals and components vital to the tech industry. However, today’s tone appears to have changed: the U.S. Treasury Secretary stated that such high tariffs are not sustainable, and shortly after, President Trump confirmed that tariffs on China could be substantially reduced, although they would not be eliminated entirely.
Additionally, in an effort to ease political tensions, Trump stated that he never intended to fire Jerome Powell, the current Federal Reserve Chair, although he hopes Powell recognizes that it's time to lower interest rates in the U.S.
These announcements have been key to the market's recent performance, helping to significantly reduce the political and economic uncertainty that had weighed on the U.S. equity markets in recent weeks. With this shift in tone, investor confidence is beginning to stabilize, which is reflected in the strong rebound of major S&P 500 components. Notable gains include Apple (+3.7%), Microsoft (+3.43%), Nvidia (+5.15%), Amazon (+7.10%), and Meta (+5.65%)—figures that have been instrumental in sustaining the short-term upward trend of the index.

Source: Slickcharts
It’s important to note that the current rally in the S&P 500 depends largely on the tone of trade negotiations. If the U.S. and China reach a concrete agreement, buying pressure could remain strong. On the other hand, if tensions reignite, market uncertainty may return, potentially stalling the current bullish move.
How Is Market Sentiment Holding Up?
The CNN Fear & Greed Index is currently at 27 points, marking its first move out of "extreme fear" territory this month and into a zone of "moderate fear."
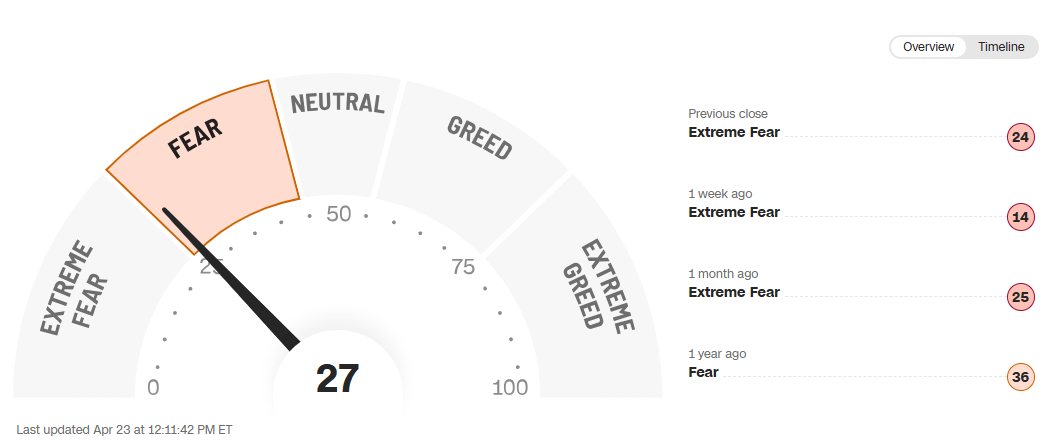
Source: CNN
This shift is significant, as the index had remained in extreme fear territory throughout April. The recent improvement is largely attributed to the easing of aggressive rhetoric from the White House regarding the trade war.
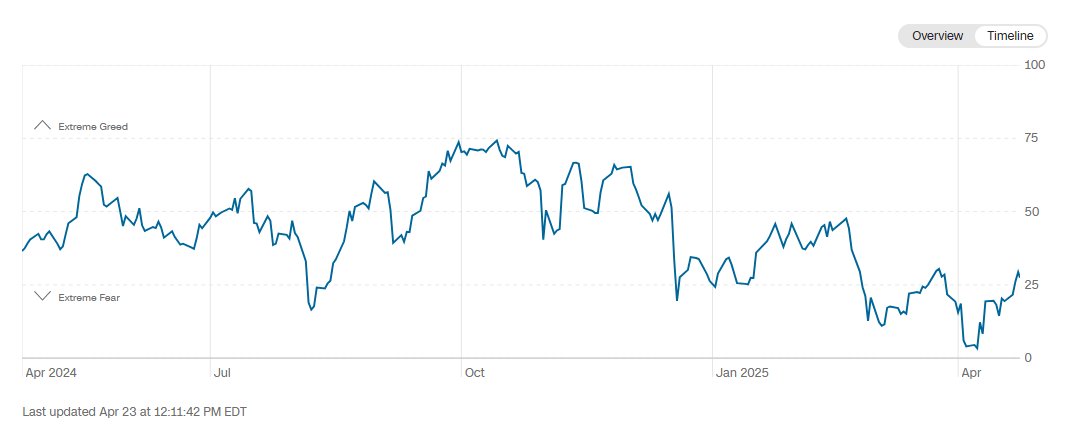
Source: CNN
If confidence continues to recover and the index stays above the 25-point mark, it could lead to a meaningful reduction in financial market uncertainty. This, in turn, could improve investor appetite for riskier assets like the S&P 500, helping to sustain upward pressure in upcoming sessions.
S&P 500 Technical Outlook
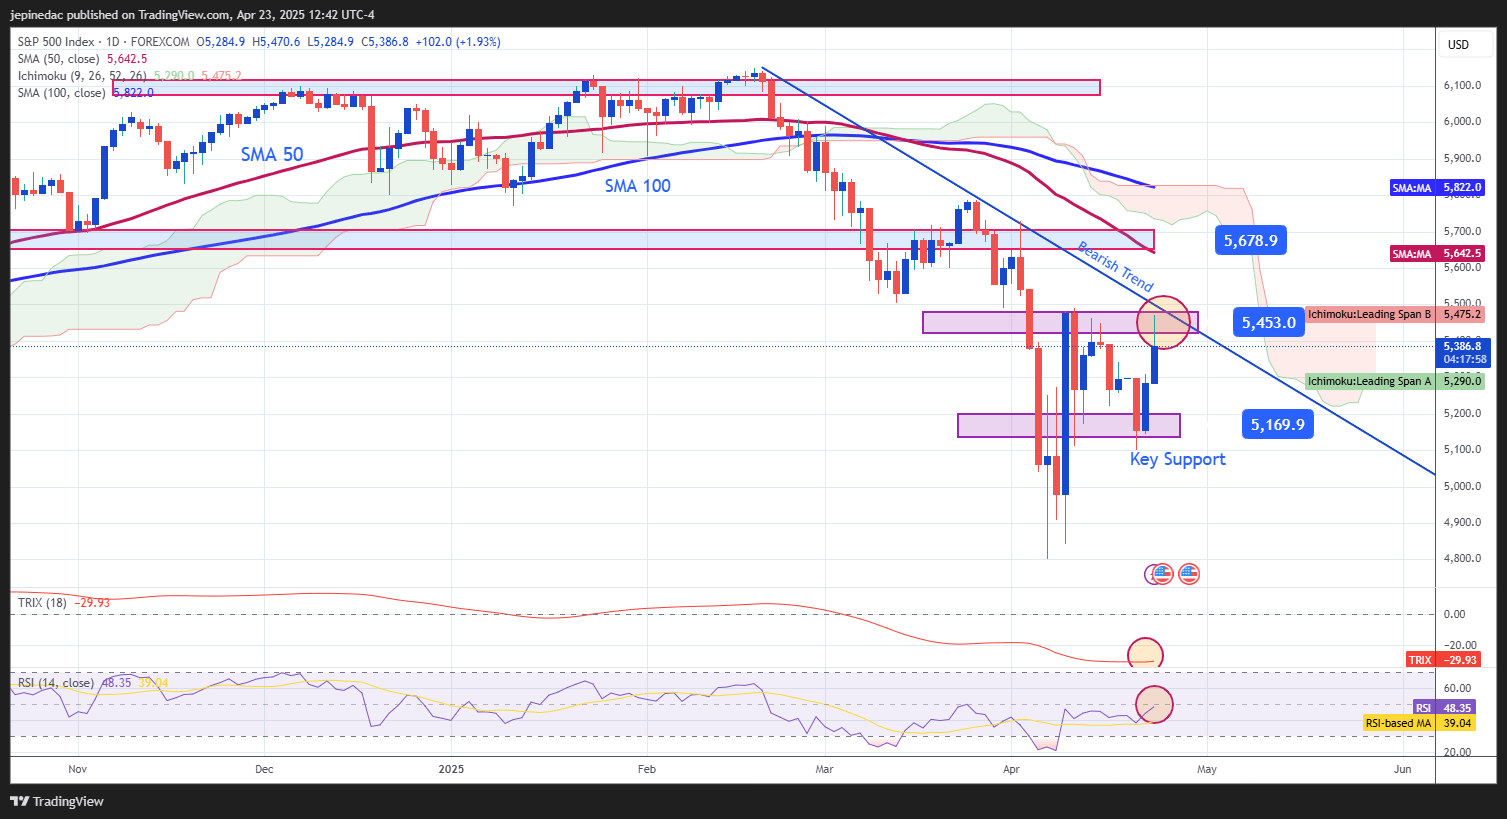
Source: StoneX, Tradingview
- Downtrend Line: Despite the recent rebound, the price has yet to break the downward trendline that has been forming since late February 2024. Buying pressure may soon encounter strong resistance, making this bearish structure the most important pattern to monitor on the long-term chart.
- RSI: The RSI is gradually approaching its neutral line at 50, signaling a balance between bullish and bearish forces. As long as the indicator hovers around this level, the market may remain in a neutral phase in the short term.
- TRIX: The TRIX indicator remains below its neutral line (0) and continues to show a downward slope, which suggests that bearish momentum still dominates. As long as TRIX stays in negative territory, the recent recovery may remain at risk of reversal.
Key Levels:
- 5,450 pts – Key Resistance: This level aligns with both the downtrend line and the Ichimoku cloud. A breakout above this zone would be crucial to confirm a trend reversal.
- 5,670 pts – Distant Resistance: Corresponds to the 50-period simple moving average. If price action reaches this level, it could reaffirm the bullish bias and pave the way for a more sustained upward trend.
- 5,170 pts – Critical Support: A recent consolidation zone. A move below this level could reignite bearish pressure and reactivate the current downward trendline on the SPX chart.
- 5,450 pts – Key Resistance: This level aligns with both the downtrend line and the Ichimoku cloud. A breakout above this zone would be crucial to confirm a trend reversal.
Written by Julian Pineda, CFA – Market Analyst
Follow in: @julianpineda25
Latest market news
Yesterday 06:00 PM
Yesterday 04:20 PM
Yesterday 04:18 PM
Yesterday 03:15 PM
Yesterday 11:45 AM

Yesterday 11:45 AM

Yesterday 08:52 AM

April 24, 2025 11:20 AM

April 23, 2025 10:59 PM